Announcement

Collapse
No announcement yet.

Interesting Chart Patterns To Monitor In Coming Days...

Collapse
X
 
  • Filter
  • Time
  • Show
Clear All
new posts

  • Anyone else notice the H&S on IBM daily that broke on the 4/16. Still has some more to play out til it hits it target, if a valid H&S. IBM used to be a great predictor of general market movement. Seems like it still may be...

    PS. Look at IBM monthly too...very interesting.

    Garth
    Garth

    Comment


    • Very interesting indeed.....

      Comment


      • Garth/Duane, hi....

        Garth, you are right on in your observation. Very good point, particulary with the chip sector having been weak lately....

        Originally posted by gspiker
        Anyone else notice the H&S on IBM daily that broke on the 4/16. Still has some more to play out til it hits it target, if a valid H&S. IBM used to be a great predictor of general market movement. Seems like it still may be...

        PS. Look at IBM monthly too...very interesting.

        Garth
        Marc

        Comment


        • I just bought 500 shares of CKR at $13.57... 1st target $16 area. My stop is not clear.... maybe today's $12.90ish low?
          Marc

          Comment


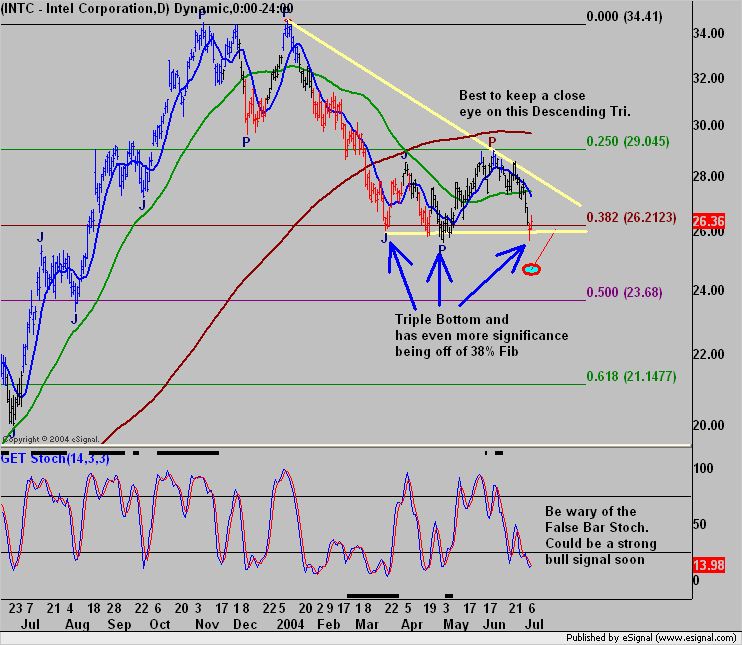
          • Nice view of INTC...

            Regards,
            Jay F.
            Product Manager
            _____________________________________
            Have a suggestion to improve our products?
            Click Support --> Request a Feature in eSignal 11

            Comment


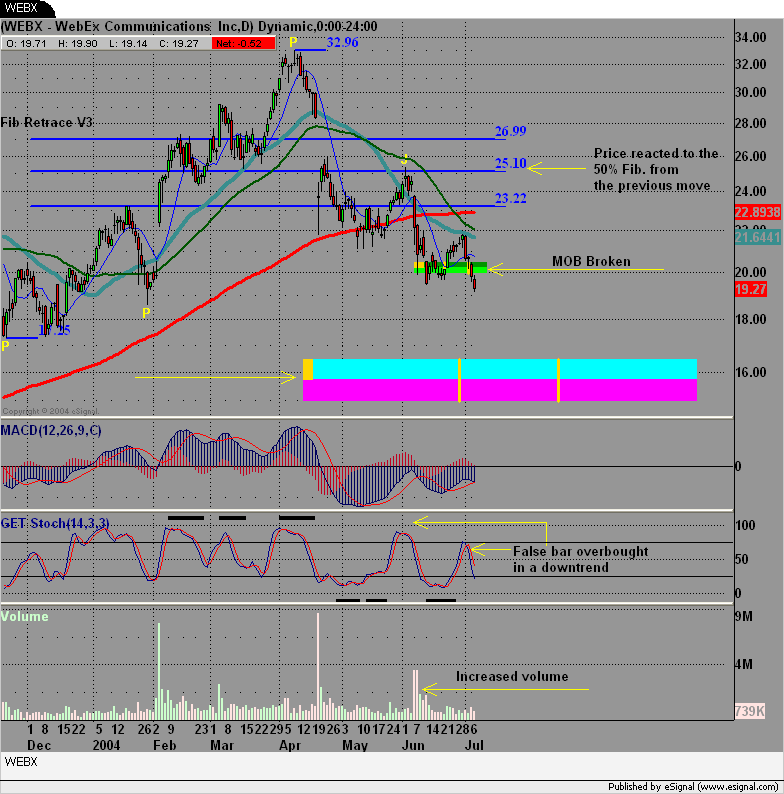
            • As well as an interesting chart of WEBX

              Comment


              • Hi Jay!

                Nice to see you here again!

                Hey, I hope you are right my friend. One thing missing so far is better Elliott 10/70 and 5/35 oscillator divergence.... You might want to watch it closely. If it doesn't build over the next month, it could be a precursor more selling pressure is still building in INTC. Hope not, but you never know with a decending triangle.

                One more thing.. watch that MOB around $25, calculated off the 5/3/04 low. It could be a very helpful indicator of future trend or swing direction to come this summer. Just a couple more things to add to your nice work.

                Thanks again for the hamburgers last December. Hope the family is doing well.

                Your long lost friend, marc
                Marc

                Comment


                • Duane,

                  Your chart work looks right on target. Noticing both the regular and 'long' alternative EW count has some projections near your lower MOB...

                  marc
                  Marc

                  Comment


                  • Hi,

                    Second attempt...first blew up. Not sure why I get periodic errors when trying to post.

                    re: INTC and descending tri

                    Typically I look for volume to confirm the tri formation. If the volume isn't drying up as the tri is forming, it is much less likely to break in the direction indicated. Descending (ie: Flat bottomed) tri's with confirming volume tend to be very reliable formations, without the confirming volume it is very much up in the air. Confirming volume also add weights to the price target if and when a break happens. At the very least, I want to see a spike in volume on the break before I will trust that the projected target price could be viable.

                    I also like to use B-Bands (1.5 std dev) to help confirm some possible price patterns. Flat tri's as well as H&S often seem to act in very specific ways wrt B Bands if they are valid.

                    The large blue lines are just ray's I put up to outline the tri, but the other lines are from a Gann formula that seemed to do well wrt to INTC price movement.

                    Garth
                    Attached Files
                    Garth

                    Comment


                    • Garth,

                      Thanks for sharing your approach! It adds to this discussion. It has been a while since we have had this kind of interest... really appreciate your and others input today! Nice work guys! -marc
                      Marc

                      Comment


                      • Just a little CMRG Update only....
                        Attached Files
                        Marc

                        Comment


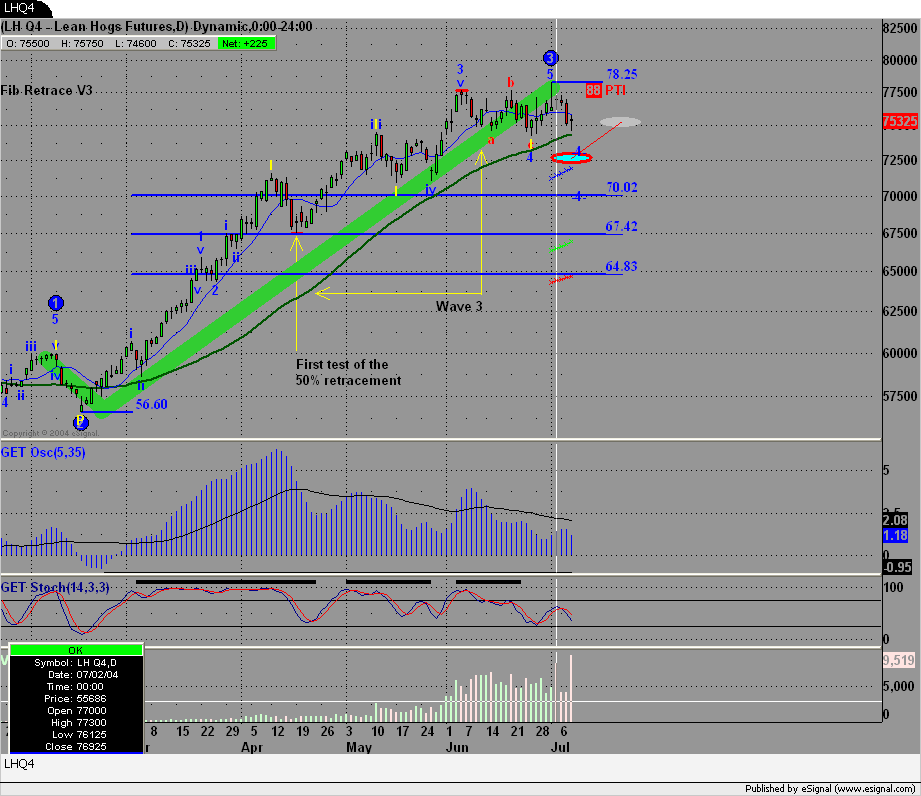
                        • I know...I know..The PTI wasn't quite > than 35, but the ellipse on 6/29 and 6/30 came in so well with the wave 4, I thought I would share. Anyone have any thoughts on the current ellipse?

                          Comment


                          • Duane,

                            No comment on the ellipse, but you bring up an interesting subject with the PTI comment.

                            My understanding (which may be flawed) is that 35 is a threashold number, and it really doesn't matter if it is 0, or 34 you are just plain more unlikely that the wave 5 will complete if it is under 35.

                            Now given that the PTI can and will change...it may well be that a 34 is more likley to turn to greater than 35 than a 22 is...

                            So, anyone care to comment on these two ideas? Is a PTI of 34 "almost" as good as a 35 and much better than a 22?

                            Is a 34 more likely to be able to turn to a 35 than say a 22?

                            Garth
                            Garth

                            Comment


                            • One more follow-up post on an earlier FBR chart...

                              Marc

                              Comment


                              • Came across this one as well. So far, so good. It will be interesting to see if the ellipse closes in step with the oscillator.

                                Comment

                                Working...
                                X