Announcement

Collapse
No announcement yet.

Interesting Chart Patterns To Monitor In Coming Days...

Collapse
X
 
  • Filter
  • Time
  • Show
Clear All
new posts

  • #16
    This chart is a quick look as a result of a question; see chart for question...
    Attached Files
    Marc

    Comment


    • #17
      Here is a stock that still has more potential to it... the skill now is how do you safely find a way to take advantage of that knowledge?
      Attached Files
      Marc

      Comment


      • #18
        INPH, attractive qualities still

        Here is a stock, if you were to go and analyze it, you may just find it still attractive, having some good qualities...
        Attached Files
        Marc

        Comment


        • #19
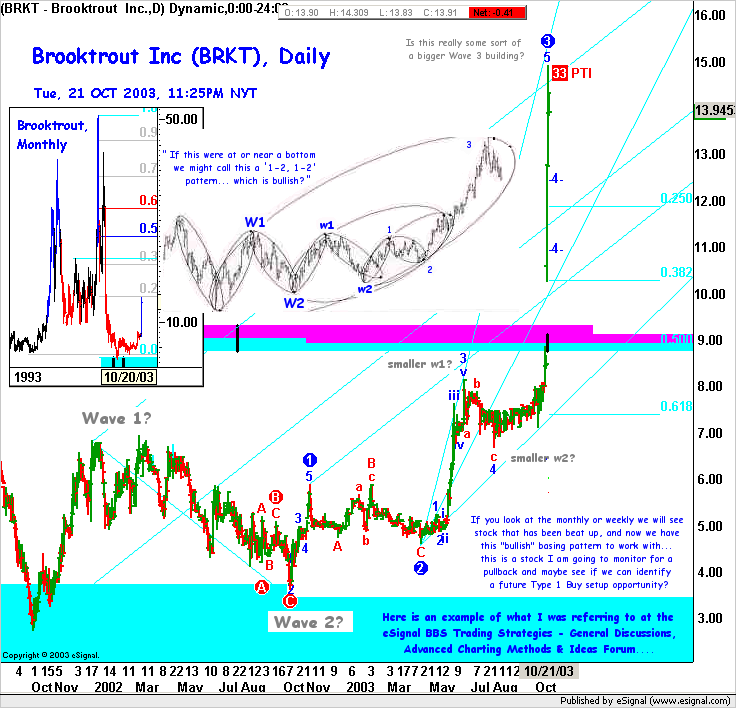
          Just a quick look at a simple cross referencing example. Here we see some sort of a weekly NWAC wave 3 labeled in progress. The daily is showing a series of higher highs and lower lows... it is unclear yet how all this is going to ultimately work out, but for now I continue to monitor for proper risk/reward opportunities. If it truly is a bigger Wave 3 building... wondering outloud what the potential really could be???? Let's monitor and see how all this evolves. (Under certain conditions my best guess is 3 to 6 months, or sooner, odds favor we see this stock higher.)

          Marc

          Comment


          • #20
            Nothing fancy, just something I am going to be monitoring the next few trading days... for the gentleman who emailed me, praying for weakness... is a little relief in sight?
            Attached Files
            Marc

            Comment


            • #21
              Here is an interesting pattern, one where if a pullback and a good risk/reward can be defined, we just might still have an interest in a possible Type 1 Buy setup opportunity? Let's stay tuned and see what evolves with this stock.... (mr)

              Marc

              Comment


              • #22
                Just an idea....
                Attached Files
                Marc

                Comment


                • #23
                  Nikkei update, xtl illustration

                  Here is an update of a previous Japanese Nikkei work done last May 2003.
                  To review a more detailed previously posted 14 May monthly and weekly Nikkei, click here.

                  Marc

                  Comment


                  • #24
                    Here is a CT Z3 Daily chart update, posted here back on 10 Oct 2003. It is just a very simple follow-up to show further strength. Comments are written on the chart . . .

                    Marc

                    Comment


                    • #25
                      Here is a quick update....
                      Marc

                      Comment


                      • #26
                        Quick hourly Wheat idea....

                        Marc

                        Comment


                        • #27
                          Just a little idea for those looking for aggressive risk/reward ideas...
                          Marc

                          Comment


                          • #28
                            This is a stock found in the eSignal Power Scan.... I took a look at this stock after finding it in the scan, then looking at news to identify reasons for its strength. The news said something about, " OmniVision Raises 2nd-Quarter Outlook." The stock continues to hold up strong today. While my job is not to trade for others, I do find identifying stronger chart movements safer to show others because they typically indicate some form of a Wave 3 in action, and they tend to often have follow-though ability later on. This fits with Elliott Wave theory. So, I tend to like to point these general types of patterns in advance so astute traders may benefit some way shape or form. Below is a current OVTI hourly chart.... you may notice, I prefer pullbacks as they provide safer entries and better risk/rewards. I have tried to give you some ideas which areas may have a stronger 'focal points.' How it would trade into a focal point would better determine its value, if any, later on.

                            Marc

                            Comment


                            • #29
                              Another very strong, interesting uptrend pattern....

                              Marc

                              Comment


                              • #30
                                Here is 5-year T-Note Interest Rates chart... forgot to put up a Stochastics with this....

                                Marc

                                Comment

                                Working...
                                X