Announcement

Collapse
No announcement yet.

Interesting Chart Patterns To Monitor In Coming Days...

Collapse
X
 
  • Filter
  • Time
  • Show
Clear All
new posts

  • Hi everyone,

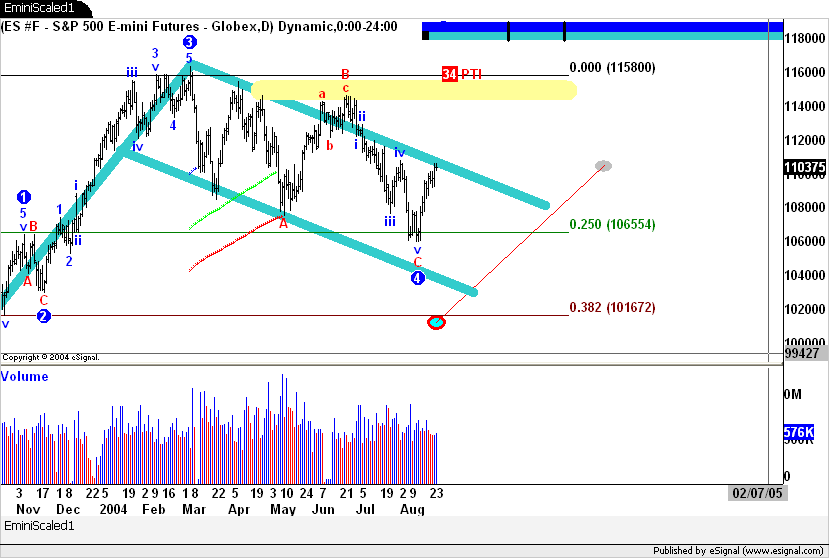
    I wanted to post a follow up to some of my previous ES charts. I think the next few days should be quite interesting as the upper channel line comes into play. Thoughts?

    Comment


    • Duane

      The Do Jones is right at the inflection point too. We are bumping up against our previous support line which has now become resistance.
      Attached Files

      Comment


      • Nice weakness in energy yesterday. To put into perspective, Crude is now back to the price it was at the
        beginning of the month. If it drops below $40 a barrel, would be more appreciated (short-term) by the markets.
        Attached Files
        Marc

        Comment


        • Here is an earlier post reminder from 8-13-04. I didn't have time to update the monthly CL #F chart.
          It did get to $48 something before it began the pullback of the last few days. Looking for a couple
          more dollars in pullback, then we have to wait and see how much the market appreciates it?

          Marc

          Comment


          • Near the beginning of August (8-6-04) I posted a comment about looking for energy complex to sell off soon.
            It took more of a rally and it was later in the month, but we are finally getting a hint the energy prices
            are beginning to stablize for the near-term.

            I said something at that time about entering a critical junction where stronger profit-taking was imminent
            in the stock market, at that time. If we would have broken that support, I think we would have witnessed
            "wave 3 down" behavior at the time. We held, and now we are in a safer position for near-term.

            Scroll down about 10 posts ago and review the monthly, weekly and daily SPY charts. There are
            simple illustrations to help you better understand the critical junction comments and later results.

            Marc

            Comment


            • Philippe and Duane,

              You might want to update your SFNT and KSS charts... good calls! Philippe, I think you have a couple bucks in SFNT already.
              Marc

              Comment


              • Hi Marc

                If the short to intermediate term bottom is in for the stock market, does anyone care to speculate whether we'll break the previous highs on this run?

                My data shows these previous highs:
                SPY: 114.94
                DJIA: 10487.54
                DIA: 105.05

                Comment


                • Just a quickly thought out guess...
                  odds 60-40 or 55-45? Not overwhelming odds right now,
                  but increasing daily more in this direction. Verdict still out....
                  Marc

                  Comment


                  • Hi Marc,

                    I re-focused my time horizon on the daily ES and came up with the following bullish flag. Looking at 3 minute charts all day long sometimes throws the long term projections out of whack...Thoughts?

                    Comment


                    • Duane

                      Sorry to butt-in to the conversation, but here are my thoughts. If the bull flag proposition is valid, we've got to burst through the previous highs on the indices with some credible oomph or else we may be just going up in a B wave.

                      Those previous highs were mentioned in my last post.


                      Jim

                      Comment


                      • Thanks for the post. Actually we want to involve as many people as possible in this discussion so your not butting in at all. Keep it up.

                        In following with my previous of the bull-flag pattern, I did some additional doodling and came up with the following chart specifically highlighting the areas you mentioned earlier. I am in complete agreement; the highlighted area is definitely a sticking point, and any subsequent breakout needs to have some serious volume to validate the pattern.

                        Comment


                        • So true, my friend, so true. You bring up a very important point.


                          Originally posted by DuaneG
                          Hi Marc,

                          .... Looking at 3 minute charts all day long sometimes throws the long term projections out of whack...Thoughts?

                          Marc

                          Comment


                          • Here is an example why trading is not a democracy.... If you wait for consensus, you never take the trade....
                            I guess sometimes you just have to be a man of conviction, u think?
                            Attached Files
                            Marc

                            Comment


                            • Marc

                              Call me crazy, but I think you'll get another opportuniy shortly to enter a QQQ trade at lower prices. Sometimes it's best to watch the correction after the initial surge.

                              Good luck

                              Jim

                              Comment


                              • Jim... didn't show it, but the short ellipse did arrive here...
                                Marc

                                Comment

                                Working...
                                X