 Tweet
Tweet
Thanks guys for sharing all your charts... good job! Hey, Duane, did u post an update on URBN yet? Didn't look at markets the last three days. First thing I noticed this morning was URBN gapped up friday 84 cents. Nice job there too! You all are doing a great job. It really is nice to see others works here. Thanks again for sharing.
-
Marc -
Hi Marc,
Friday was a pretty good day for URBN. The next few days should prove to be somewhat interesting as we are now running into the short term MOB. IMHO, should we clear the $32 level, the chances are good that it should hit $34. Wait and see....
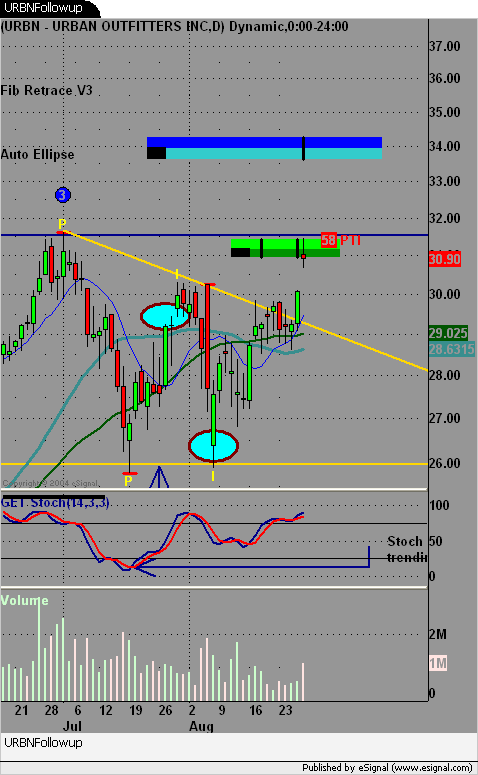
Comment
-
Jim, just following up on your last QQQ comment... so far so good.... if crude gets around $40
or lower soon, you might see QQQ push above short ellipse next time to test normal ellipse.
Is just a guessing is all.Attached FilesMarcComment
-
-
There is a phenomenon I have observed over the years.
Whenever I see a bad tick pop up, I make a mental note of it. Often that bad tick gets edited out of data. I try to remember where a bad tick was because over the years I have observed a propensity for the market to eventually gravitate toward the upper/lower part of that bad tick spike bar range.
Take this SBC hourly chart below, for example. I think this is a bad tick on 8/20/04. If I am correct, within two weeks we should witness a push toward the 26.50 range???
Why does this phenomenon happen? Is it a way 'someone' tips off the direction they want to see the price push? Or, is it just an honest transposition mistake made by someone on the trading floor entering an incorrect figure in a hurry? Again, this is total speculation.... but I think it often points the direction of the next bigger move. Maybe someday a professor can get a graduate student to work on this hypothesis to prove me right or wrong?
If someone ever proves this hypothesis, remember to call it the Rinehart bad tick trade phenomena, ok? This way I have something to put on my tombstone as a little calm to fame.
Maybe this example doesn't work out. Don't give up on the idea. Try playing with this idea in the future. See if I am on to something. See if this idea ends up helping you with your trading.Attached FilesLast edited by MR; 08-30-2004, 02:22 PM.MarcComment
-
-
Duane,
Your KSS keeps going up. Nice call.MarcComment
-
Hi Marc,
Thanks for the comments. Not a bad little gap this morning, but we'll wait and see if it backfills. Still about 3-4 points away from the MOB at $53. Nate was right....Wave 3 is a wonder to behold. Good luck.
Comment
-
Classic type 1 sell in the Nasdaq futures in progress:
5,35 Oscillator pullback, 38% Fib retracement, PTI > 35
Following...
PRHAttached FilesComment
-
-
Philippe,
Forgive me... i just got the joke about Pork Bellies... I thought it was a new pattern formation.... belly button... LOL!
Nice Nasdaq chart.... Keep an eye on the normal ellipse too just in case you see the price slipping back up again later this week.
Best wishes my friend, and keep them coming. Excellent work you do.
Marc
Originally posted by P.Housmans - Posted: 08-27-2004 05:20 PM
Notice the 4-hole button formation on the February Pork Bellies:
(Bellies button)
(I could not resist) Originally posted by P.Housmans
Classic type 1 sell in the Nasdaq futures in progress:
5,35 Oscillator pullback, 38% Fib retracement, PTI > 35
Following...
PRHMarcComment
-
Thank you Marc.
A rally to the normal ellipse is indeed possible. Our stops are in place for that scenario should it evolve.
Wheat starts to form a bottom and may build a sideways to upside bias. Corn is bumping into the 239 resistance again.
PRHComment
-
Looking like an 'up' biased day today.MarcComment
-
Hi Folks
I am going to go out on a limb here. I think a very credible bottom was put in on 8-13-04 in SPY. I think what we are seeing is a wave 1 up with a complex wave 2 in progress. Where W2 will take us is anyone's guess, but I think we may be on the way to the bull flag scenario. Just a guess.Attached FilesComment
-
-
Why did I ever have to chicken out of FE daily? Still heading upward to the target. Noticed that whole sector doing well lately.MarcComment
-
Jim, I always respect your opinion....
(As a side comment, watching to see if SPY daily can take out, close above today' high. I think that it can keep going some more if it does this today or tomorrow.)MarcComment
-
Mutual fund managers play strategic money management games, such as position squaring, unwinding of hedges, etc.... It can affect a market.
The beginning of each new month or quarter there can be a wonderful, predictable phenomenon to watch for when trading.
For example, watch to see if the 'up biased' market today-- Sept 1st-- continues the rest of this week, or will it reverse direction by Friday?
Some people believe you can tell a lot by observing closely a few days of trading action at the beginning of each new month or quarter. Let's watch together and observe trading action the next few days.
Depending on what happens, I will try to find time to explain later what I mean by this, or if someone else would like to share their ideas here on this topic, please feel free to do so.
May the trades all go your way this week,
Marc RinehartMarcComment
-
Isn't it interesting how the Ellipse study works so well a lot of times?
Take, for example, this attached daily Crude Oil chart.
It bounces very nicely today off the Short Ellipse arrival.Attached FilesMarcComment
-
Comment