Announcement

Collapse
No announcement yet.

AGET Oscillator Misc Questions and Answers

Collapse
X
 
  • Filter
  • Time
  • Show
Clear All
new posts

  • AGET Oscillator Misc Questions and Answers

    According to Tom Josephs, Wave 4's 5,35 OSC cannot exceed 140% retracement on a Daily Chart. However, does such an OSC "pullback" rule also apply to *intraday* Wave 4's?

    For example, if you look at the 15-min intraday chart of $INDU (Dow Industrials) for today (Feb 18), you'll notice that the Wave 4 OSC has definitely exceeded the 140% OSC rule. However, PTI is still above 35 (is at 64), so I wonder if the impulse wave is still in place.....or, will waves 1-3 be relabled as ABC?

    Thanks in advance!

  • #2
    Re: Do Intraday Wave 4 OSC limits follow Daily limits?

    Yes, the 1.40 oscillator principle transcends time frame.
    The .90 to 1.40 pullback rule applies for all time frames
    where you are trying to establish a Type 1 setup....
    the waves will not reliable to A-B-C until Wave 4 & 1 overlap,
    and that could vary depending on what setting you have
    in the Elliott Wave default overlap selection.


    Originally posted by makeithappen
    According to Tom Josephs, Wave 4's 5,35 OSC cannot exceed 140% retracement on a Daily Chart. However, does such an OSC "pullback" rule also apply to *intraday* Wave 4's?

    For example, if you look at the 15-min intraday chart of $INDU (Dow Industrials) for today (Feb 18), you'll notice that the Wave 4 OSC has definitely exceeded the 140% OSC rule. However, PTI is still above 35 (is at 64), so I wonder if the impulse wave is still in place.....or, will waves 1-3 be relabled as ABC?

    Thanks in advance!
    Last edited by MR; 02-19-2003, 05:15 PM.
    Marc

    Comment


    • #3
      For those who are not sure what the 1.40 is we are talking about, attached is a quick example. This calculation has value
      when trying to frame up a Type 1 setup.
      Attached Files
      Marc

      Comment


      • #4
        Thanks Marcus!
        Would you mind looking at the 5,35 OSC for today's Dow 15-minute chart? I show that the Wave4 OSC retraced 180%. However, the 60-min shows the Wave4 OSC hasn't even retraced 90% yet.

        While I do understand that OSCs display differently in different timeframes, the 15-min impulse wave should now be invalid because its wave 4 retraced too far...right?

        Comment


        • #5
          Wave 4 Intact

          Hi, I saw your post and it looks to me like the wave 4 is intact on the Dow, 15. See attachment.
          Attached Files

          Comment


          • #6
            Oscilator EFS for E Signal Beta

            HI:
            I am looking to find the new Oscilator overlays with all 3 Osc. stacked. I e-mailed Marcus and he said he found them as an EFS that someone had posted.
            Basically, I am lost in cyber- land, and would appreaciate a lifeline.
            Thanks,
            Tom

            Comment


            • #7
              Tom
              FWIW you don't necessarily need an efs to merge multiple studies.
              For instructions on how to do it without using an efs click here.
              Alex

              Comment


              • #8
                Alexis:
                Thank you for your generousity.

                Comment


                • #9
                  Re: Oscilator EFS for E Signal Beta

                  Originally posted by Harndog
                  HI:
                  I am looking to find the new Oscilator overlays with all 3 Osc. stacked. I e-mailed Marcus and he said he found them as an EFS that someone had posted.
                  Basically, I am lost in cyber- land, and would appreaciate a lifeline.
                  Thanks,
                  Tom
                  Hi Tom!

                  I am not sure if it was me, "Marcus" you were referring to, but am
                  pretty sure it I would not have said that. I can barely spell EFS.... Below is how I would recommend overlaying the three AGET Oscillators. If you need any other assistance, please feel free
                  to call (330) - 645 - 0077 or email: [email protected]
                  Attached Files
                  Marc

                  Comment


                  • #10
                    Oscillator studies with strength band

                    Marcus:
                    You are correct, you are the Marcus I was talking about.
                    I have a suggestion for the Oscillator combination:
                    Please make the Oscillator Strength Bar lines - optional - with a check box. On my chart, the extra oscillator lines tend to clutter up the screen.
                    Thanks, Tom

                    Comment


                    • #11
                      Tom
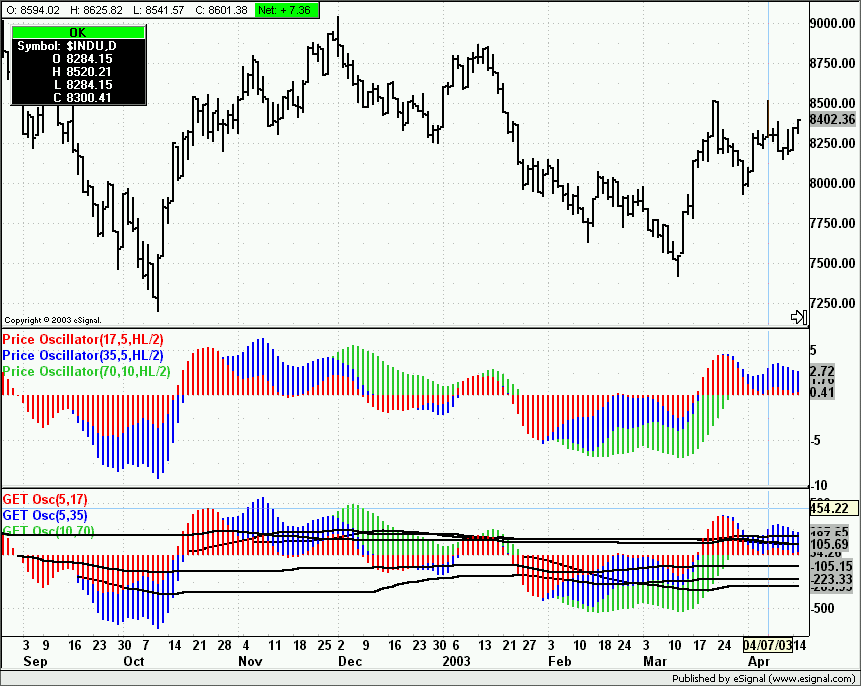
                      The AdvancedGET Oscillators are essentially a Price Oscillator based on HL/2. What makes them unique is the Strength Band.
                      So, if you want to plot them without the Strength Bands just use the Price Oscillator available in the Basic Studies. The returned values will read differently from those of the GET Oscillators but the 'shape' of the plot(s) is the same as you can see in the image below.
                      Alex

                      Comment


                      • #12
                        all oscilators in 1 study

                        I have been seeing on these posts where all 3 oscilators
                        5/17, 5/35 & 10/70 are shown in the same study window (superimposed). How can I do this?

                        Gregg Updike
                        Gregg Updike

                        Comment


                        • #13
                          Gregg
                          Instructions are available here.
                          Explanations of the various steps are in the text at the top of each image.
                          Alex
                          Last edited by ACM; 05-28-2003, 10:53 AM.

                          Comment


                          • #14
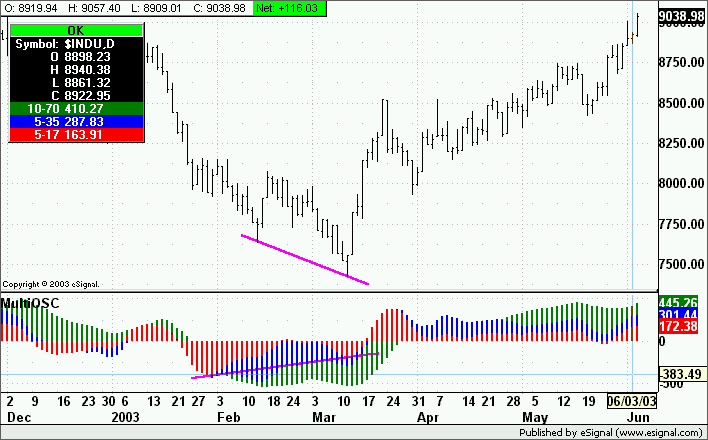
                            If anyone is interested the attached EFS plots all three Get Oscillators in a single pane.
                            There are a couple of advantages to using the EFS as opposed to overlaying the three individual Oscillators.
                            First one does not have to load all three oscillators every single time a new chart is created. Second it takes out the guesswork in trying to overlay them in the correct order. In fact the efs plots them with the short term oscillator always on top and the longer term always last in the overlay.
                            This makes identifying short term divergences such as the one visible in the image below an easy task.
                            Lastly it does not plot the Strength Bands taking away an extra editing step.
                            Alex

                            NOTE: This EFS makes use of Get EFS functions so a subscription to the Get Studies is required to run it.

                            Attached Files
                            Last edited by ACM; 06-05-2003, 07:29 AM.

                            Comment


                            • #15
                              Alex thank you for your reply since your A-GET study looks different mine I assume that you are using the E-signal software with A-GET as an add on I have just A-GET. Are you able to incorporate EFS using A-get as a stand alone software?
                              Gregg Updike

                              Comment

                              Working...
                              X