 Tweet
Tweet
Marc,
There are many threads on continuation trades with XTL and variations through which I could have posted the content of this thread. I elect to add a new thread so that:
1. I may confess and seek redemption, You and the good folks on this board can critically assess my recent failed attempt. .....
and to focus specifically on:
2. Set ups for continuation trades - what to look for and in what time frames.
3. How to monitor and mange such a position.
4. Finally if we can cover search parameters of the above.
Recent bullish market action particularly in Tech has produced explosive EW3 patterns which are chacterized as:
1.By rule, Wave 3 is never the shortest, usually longer than 1&2 (T-26)
2.Room to grow, 75% probability that W3 will reach 1.62-2.62 * w1
If W3 can be identfied early enough in its development, a trader can place positions which gain from a few days of directional in this case bullish movement or at least horizental movement. The liklihood of success for a position which can gain from 2 out of only 3 possible directions is 2/3. The trade duration is only 2-14 days, this is not a long term directional trade in which pull backs are tolerated because the daily and weekly say that it will eventually correct back to target.
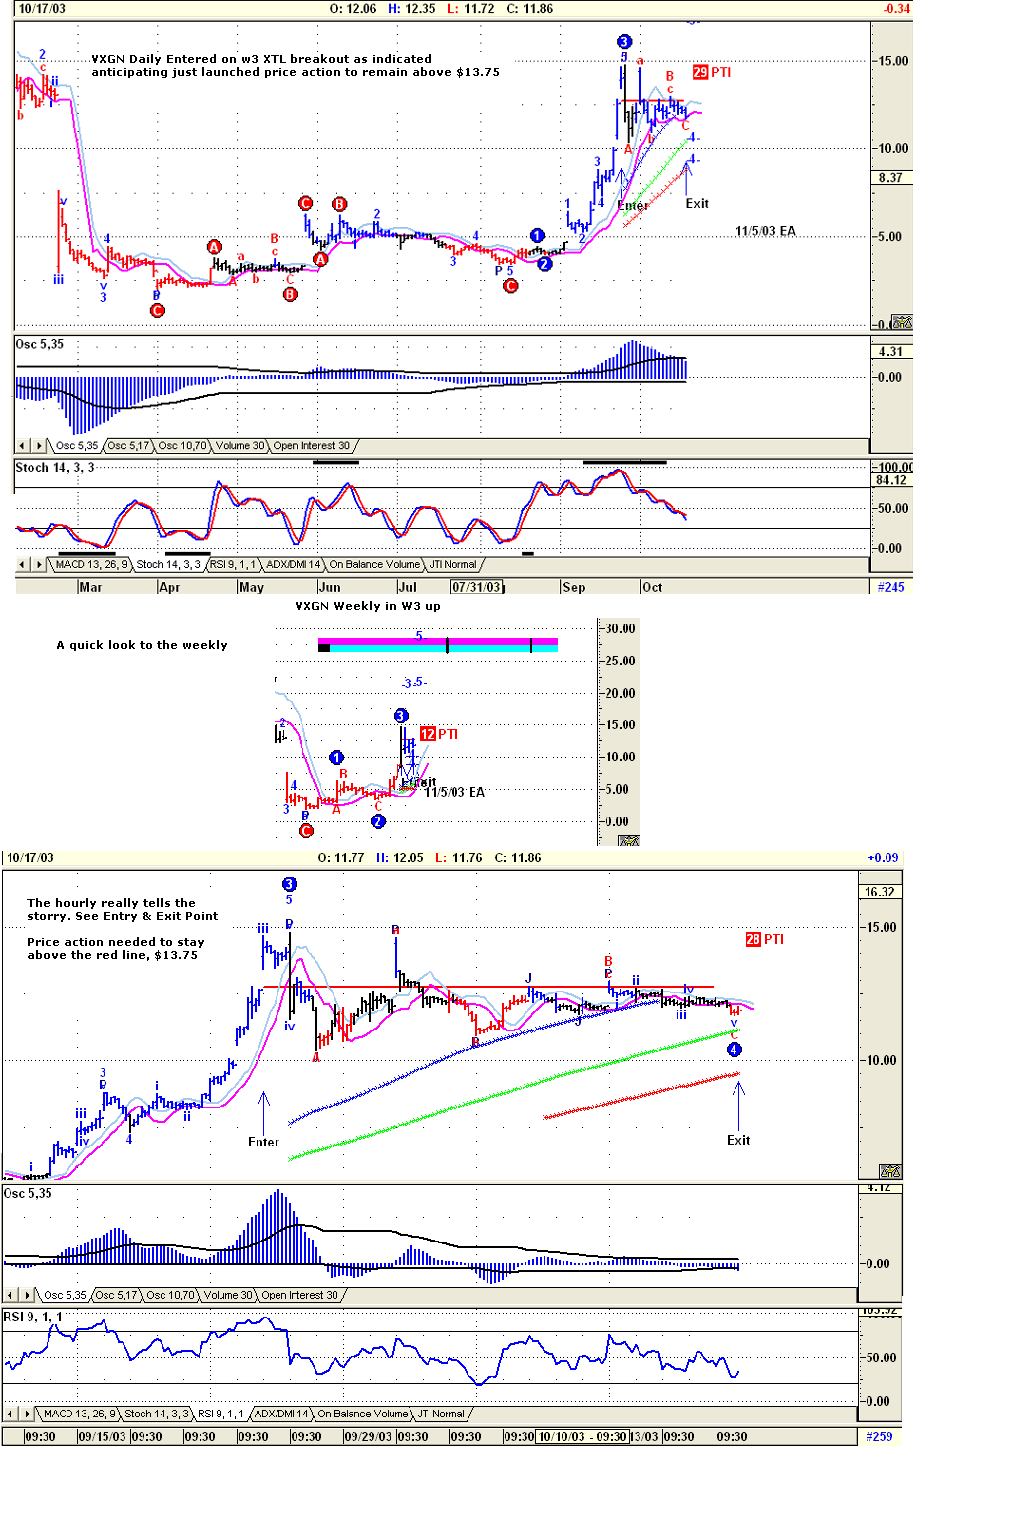
on 9/23/03, I identified from daily scans a young wave 3 developing for VXGN, it closed at $12.65. I looked for:
All Daily Parameters
-----------------------------------------------------------------------
1. Daily W3 labeled
2. Powerful 5/17 OSC breakout > 200% of Breakout band
3. Powerful 5/35 OSC breakout > 200% of breakout band
4. ADX > 40 Trending
5. RSI> 90 pointing up, strong moomentum
5. Stoch %K & %D > 95, strong momentum
6. No MACD crosses above 80, No overbought signal.
Weekly Parameters
------------------------------
1. Just turned into W3 up
Did not have Hourly Data. Based on the above, the next morning, I took a mildly aggressive position that price action would go above $13.75 (the red line) within a few days, 8.7% above the close on 9/23
As you can see from the charts, only the day I opened the position that VXGN ever closed above $13.75, and was there only on 3 days as I held on longer for the position to break out of its abc correction pattern and continue its wave3.
During the trade, I saw daily:
1. XTL Blue on.
2. 5/17 OSC drop to zero
3. 5/35 OSC decline.
4. 10/3 MACD crossed
5. on 10/13, even the false Stoch bar dissappeared
6. RSI dropped
I still had not had Hourly data. During this trade, all the signs were there to exit. The question now is how do u look for continuation of young wave 3 and what do you monitor to remain in it.
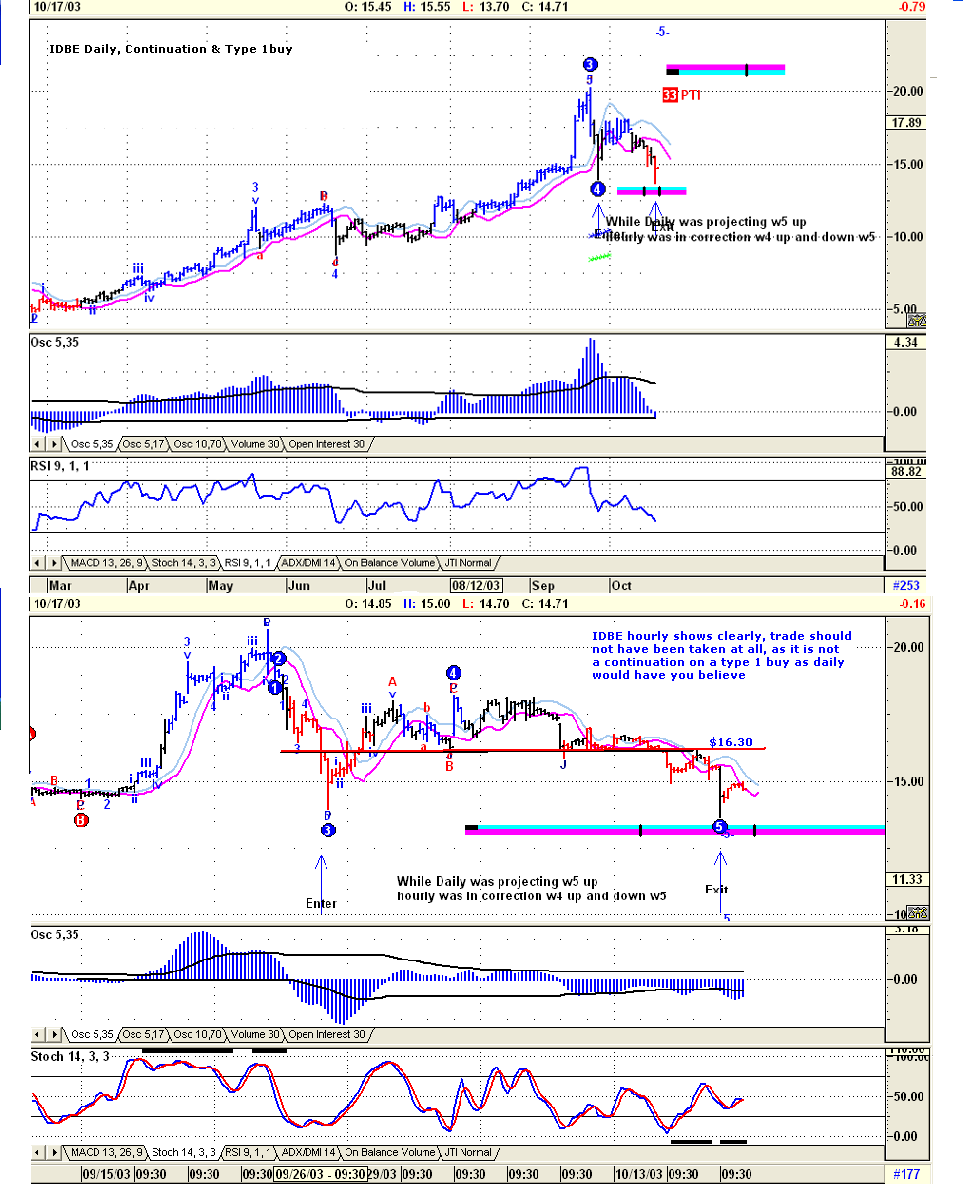
Failed continuation is not exclusive to wave 3 only, below I show another failed continuation on a projected wave 5 up, a type 1 buy. Again, I did not have hourly data to see a totally opposite formation taking place. I entered on 9/26/03 9:30 AM and exited 10/17/03.
Is it safe to conclude that I should look for these on hourly scans, time entry and exit on hourly data, and simply confirm daily direction and not necessarily exact wave formation as that of hourly?
Fortunately, wins exceed losses permitting me to Die Another Day.
The Charts depicting the sins follow:
First Example: Continuation along W3
Second Example: Continuation along Daily Type 1 buy
There are many threads on continuation trades with XTL and variations through which I could have posted the content of this thread. I elect to add a new thread so that:
1. I may confess and seek redemption, You and the good folks on this board can critically assess my recent failed attempt. .....
and to focus specifically on:
2. Set ups for continuation trades - what to look for and in what time frames.
3. How to monitor and mange such a position.
4. Finally if we can cover search parameters of the above.
Recent bullish market action particularly in Tech has produced explosive EW3 patterns which are chacterized as:
1.By rule, Wave 3 is never the shortest, usually longer than 1&2 (T-26)
2.Room to grow, 75% probability that W3 will reach 1.62-2.62 * w1
If W3 can be identfied early enough in its development, a trader can place positions which gain from a few days of directional in this case bullish movement or at least horizental movement. The liklihood of success for a position which can gain from 2 out of only 3 possible directions is 2/3. The trade duration is only 2-14 days, this is not a long term directional trade in which pull backs are tolerated because the daily and weekly say that it will eventually correct back to target.
on 9/23/03, I identified from daily scans a young wave 3 developing for VXGN, it closed at $12.65. I looked for:
All Daily Parameters
-----------------------------------------------------------------------
1. Daily W3 labeled
2. Powerful 5/17 OSC breakout > 200% of Breakout band
3. Powerful 5/35 OSC breakout > 200% of breakout band
4. ADX > 40 Trending
5. RSI> 90 pointing up, strong moomentum
5. Stoch %K & %D > 95, strong momentum
6. No MACD crosses above 80, No overbought signal.
Weekly Parameters
------------------------------
1. Just turned into W3 up
Did not have Hourly Data. Based on the above, the next morning, I took a mildly aggressive position that price action would go above $13.75 (the red line) within a few days, 8.7% above the close on 9/23
As you can see from the charts, only the day I opened the position that VXGN ever closed above $13.75, and was there only on 3 days as I held on longer for the position to break out of its abc correction pattern and continue its wave3.
During the trade, I saw daily:
1. XTL Blue on.
2. 5/17 OSC drop to zero
3. 5/35 OSC decline.
4. 10/3 MACD crossed
5. on 10/13, even the false Stoch bar dissappeared
6. RSI dropped
I still had not had Hourly data. During this trade, all the signs were there to exit. The question now is how do u look for continuation of young wave 3 and what do you monitor to remain in it.
Failed continuation is not exclusive to wave 3 only, below I show another failed continuation on a projected wave 5 up, a type 1 buy. Again, I did not have hourly data to see a totally opposite formation taking place. I entered on 9/26/03 9:30 AM and exited 10/17/03.
Is it safe to conclude that I should look for these on hourly scans, time entry and exit on hourly data, and simply confirm daily direction and not necessarily exact wave formation as that of hourly?
Fortunately, wins exceed losses permitting me to Die Another Day.
The Charts depicting the sins follow:
First Example: Continuation along W3
Second Example: Continuation along Daily Type 1 buy
Comment