Announcement

Collapse
No announcement yet.

The Ellipse

Collapse
X
 
  • Filter
  • Time
  • Show
Clear All
new posts

  • #16
    You can use it anywhere you want.
    For example at the end of a B wave to enter what is initially a C and which could then evolve into a 3.
    Or you can use it as a protective stop for an existing trade.
    The basic principle is excellent risk/reward evaluation because you are measuring retracements against defined points of inflection while being able to define a projection.

    The interesting thing is that it is an invaluable tool even when it fails because it provides signals for stop and reverse trades (will try to provide example a bit later using today's INTC set up)

    Alex
    Last edited by ACM; 01-09-2003, 06:17 PM.

    Comment


    • #17
      Recent Ellipse Example

      Enjoyed reading your Advanced GET Ellipse study discussion.

      If interested, just posted a recent sample of a Type 1 Buy setup using the Ellipse study.


      In addition, check out AGET "Trader's Outlook" link for additional examples of recent Ellipse applications.
      ( http://markets.advancedget.com )

      - Marc Rinehart, AGET Tools and Studies

      Comment


      • #18
        Here's a picture of Amazon. I draw the Ellipse from the W2->W3.

        Is the idea that price might bounce off the colored Ellipse around $11.00 and then retrace back to shadowed ellipse @ 12.59?

        thx.m.

        Matt Gundersen

        Comment


        • #19
          No the Ellipse and its shadow will in time approach each other, overlap and lock in position.
          As an initial target for where I expect this to happen (and where I would expect it to meet price) I usually look at somewhere in between the ellipse and the shadow along the line that joins them. In the mean time as prices evolve I do however want to see the shadow as much as possible in line with current prices.
          Why? Because (and I will add that this purely a personal opinion) if current price gets too far ahead (or behind) the shadow then that ellipse may not be reliable. By my understanding of the tool this is due to the fact that prices are either descending (in this example) faster/slower than they should in relationship to time and to the swing you are measuring.
          If and when that Ellipse will converge with prices then you will plot another Ellipse form the swing high to the swing low to measure a reaction rally.
          Alex

          BTW the chart posted was for ORCL, not AMZN
          Last edited by ACM; 01-15-2003, 12:10 PM.

          Comment


          • #20
            A Question for Alexis the Ellipse Master...

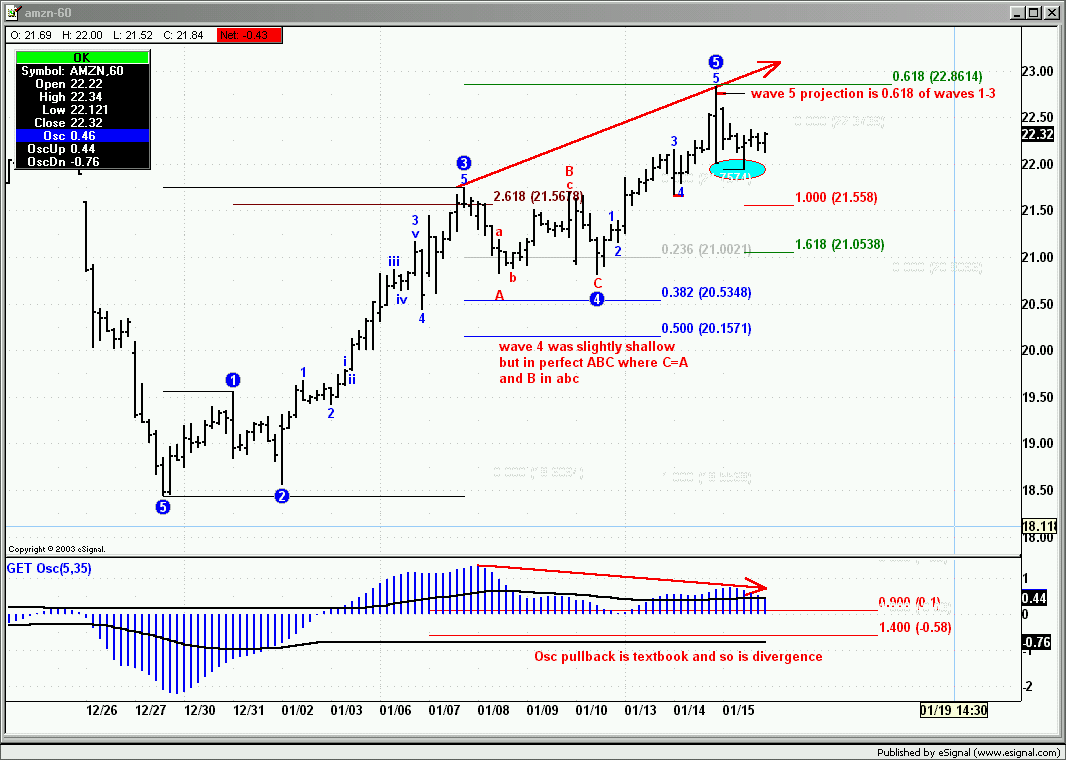
            Here's Good ol' Amazon on a 60 minute basis. It's just formed a 5 and if all goes well it will begin a descent.

            Two ellipses were drawn. Both from W4 and W5 labels. Drawing an ellipse based on the W4 and W5 labels in the past created an ellipse @ W3.

            Drawing an ellipse on the most recent W4 and W5 drew an ellipse that price hasn't reached (yet). Is the idea on the most recent ellipse that a W3 may occur when price intersect the ellipse?


            In this next picture, same chart, different Ellipse. The ellipse was created off the two most recent W5's. Is the idea here that if price intersects with the ellipse, it will also be the bottom of the wave (the next W5 label yet to be formed)?


            Matt Gundersen

            Comment


            • #21
              Matt
              Before I even attempt a reply would you mind telling me how you can get more than one image in a message and how to have it appear inline (rather than as an attachment)?
              Alex

              Comment


              • #22
                Real easy...

                I publish an image to the fileshare. Immediately after publishing the image, I come over to the big editbox the forum and press the IMG button just above the big edit box where you type this message. When you press the image button, a box pops up and you can paste the url. After you press OK on that popup box, it pastes the appropriate "stuff" into your message.

                Essentially it's doing this

                [ img ] http: // your url / yourpicture.png [ / img ]

                I added a bunch of spaces to the above so that it is readable. Otherwise it could have interpreted it as an inline picture.

                Put as many of those [ img ] things in a message as you like.

                m.
                Matt Gundersen

                Comment


                • #23
                  Matt

                  It's just formed a 5 and if all goes well it will begin a descent

                  Why "if all goes well"? You short already? <vbg>

                  Jokes aside, yes, it does appear to be a completed upwards 5 wave pattern.
                  The first suggestion that comes to mind is not to rely exclusively on the fact that Get has labeled the waves but also to use the Fib Ret and Ext tools to measure if these waves actually match the expected excursions.
                  In this case the 5th wave has indeed come very close to the extension of 0.618 of waves 1 to 3 and in light of that we could be seeking an opportunity for a Type 2 Sell .
                  Note: If I don’t mess up with this technology there should be an inline image of the 60 min chart here.


                  With regards to the Ellipses, here is what appears to be the difference in how you are trying to use this tool at this point versus how I tend to use it. Mind you I am not implying that there is a right or wrong way, I am just highlighting the differences and illustrating my modus operandi.
                  It seems to me that you are using the Ellipse to determine where a market will be, whereas I first establish the direction I believe this market is in - primarily by means of Elliott waves - and then use the Ellipse to time my entries in that direction by taking advantage of every countertrend swing that will reduce my risk. That is truly where the Ellipse shines and is unrivaled IMO.

                  Going back to the beginning of your message you say this market should begin a descent. At the same time, though, you plot an Ellipse in the opposite direction that instead tells you where support is projected. That will come handy in time but for now it is less relevant IMO
                  Using your initial assumption, I would instead fall back to a lower interval to find an Ellipse from above (ie to determine where resistance should be in an upswing) that would allow me to short this market with the least amount of risk or at least with a risk that is commensurate to the reward.

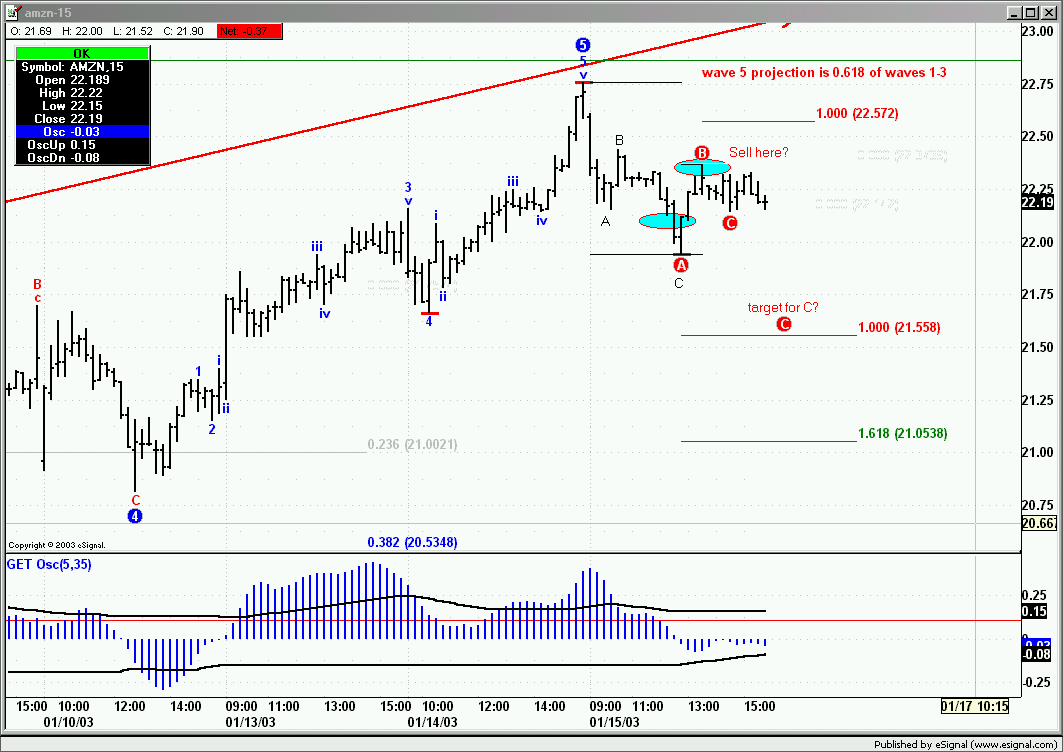
                  For sake of argument let us assume that we do indeed want to short. As I said I would scale back to a 15 min (or maybe less depending on how deep the pockets are) to find a trade in the direction I want. At That point I would plot an Ellipse from the high to whatever significant low will be put in place and then use the Ellipse to enter my short.
                  When I say “significant low” I mean significant in Elliott terms ie a pattern that means something in the context of what I am trying to achieve.
                  Hence from the 5th wave high we have a move down to where a support Ellipse kicked in. That move is in 3 waves so it could be a completed correction or part of a larger ABC pattern. Irrespective we wait for the short which will be signalled by the Ellipse from above.
                  While that Ellipse is intercepted at around 22.30 we need to put a stop above 22.57 because that is the extent this market could go up on a smal abc.
                  At the same time we establish a target which would conservatively be for a 100% extension of the A wave hence somewhere in the 21.50 range. Now we have a risk, reward and an entry signal provided by the Ellipse and if we like it we take the short.
                  Note: An inline image of 15 minute chart should appear here


                  All the above aside, before even looking at Ellipses the more important question IMO is to evaluate what this 5 wave pattern is in a larger context because that will help you determine if being short has any merit.
                  Whatever the scenario you then project your targets, establish your risk and lastly use the Ellipse to enter the trade in the direction you want.

                  Drawing an ellipse on the most recent W4 and W5 drew an ellipse that price hasn't reached (yet). Is the idea on the most recent ellipse that a W3 may occur when price intersect the ellipse?

                  Not necessarily. For starters you do not know at this point what this upwards 5 wave pattern is. If you look at the daily chart at this moment it would appear to be part of a larger 5th wave up (for sake of argument I will disregard whatever signals may be suggesting that this count may change else this message will never end).
                  Therefore this could be but a fractal of that move. If that were the case, after an impulsive 5 wave pattern the conservative approach would be to expect a 3 wave corrective pattern ie an ABC.
                  Therefore IMO talking about a wave 3 downwards at this point is premature. Again I suggest always measuring your waves. If that were wave 3 then where would waves 1 and 2 be? How would the wave 3 then measure as an extension of wave 1?

                  In this next picture, same chart, different Ellipse. The ellipse was created off the two most recent W5's. Is the idea here that if price intersects with the ellipse, it will also be the bottom of the wave (the next W5 label yet to be formed)?

                  What I said before regarding Elliott waves applies also here. You have a 5 wave move up which could be many things and you have no downwards structure yet. It is way to early IMO to even consider what the pattern will be if and when it will intercept the Ellipse.
                  As of now I would just look at it and pick the midpoint between the Ellipse and its shadow and start considering that price/time combination as a possible target once I have determined what the structure of the pattern in formation is.
                  Once prices will meet that Ellipse and in accordance to what the Ellliott wave structure will be at that time then and only then will I decide to use that Ellipse for a trade.

                  Lastly can you ask simpler questions <vbg>?

                  Alex
                  Last edited by ACM; 01-16-2003, 09:35 AM.

                  Comment


                  • #24
                    Before I go an start a how-to thread of Q&A on the fibonacci tool, doesn't get draw fib projects of the W3, W4, and W5 with the -3-, -4-, and -5- labels?

                    m.
                    Matt Gundersen

                    Comment


                    • #25
                      Re: Reply to post 'The Ellipse'

                      Yes it does, just like an inertial navigation system projects where you
                      "should be" based on the data it has.
                      That does not mean the pilot will not crosscheck with some other tools "just
                      in case"

                      The other point is that you still want to have alternative counts available
                      to you should Get change its count based on how the market evolves. If you
                      have those counts done and measured then you are ready to re-evaluate the
                      situation and act accordingly.

                      Alex
                      Last edited by ACM; 01-16-2003, 06:28 PM.

                      Comment


                      • #26
                        Continuing to play with AMZN

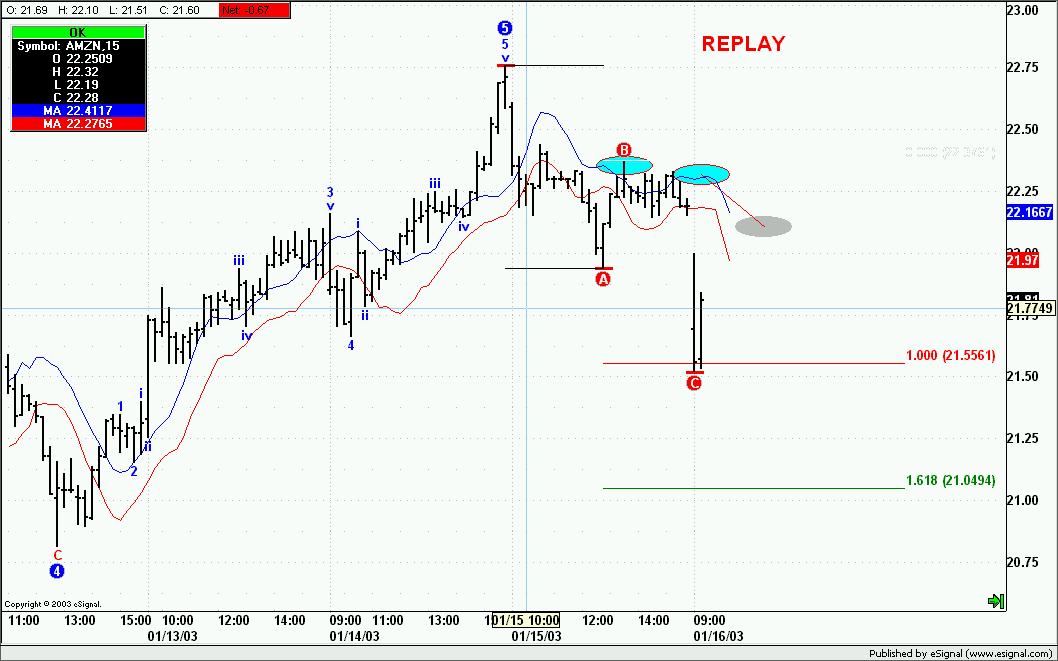
                        Assuming we did indeed take a short on the Ellipse at 22.30 approx we now find ourselves with this market reaching an ABC swing target at 21.55.
                        For the sake of this argument we assume that we are not going to take profits here because a) we are greedy b) we honestly believe there may be further weakness.
                        At this point with a low in place we do however want to protect our trade so we could use the Ellipse to manage the stop.
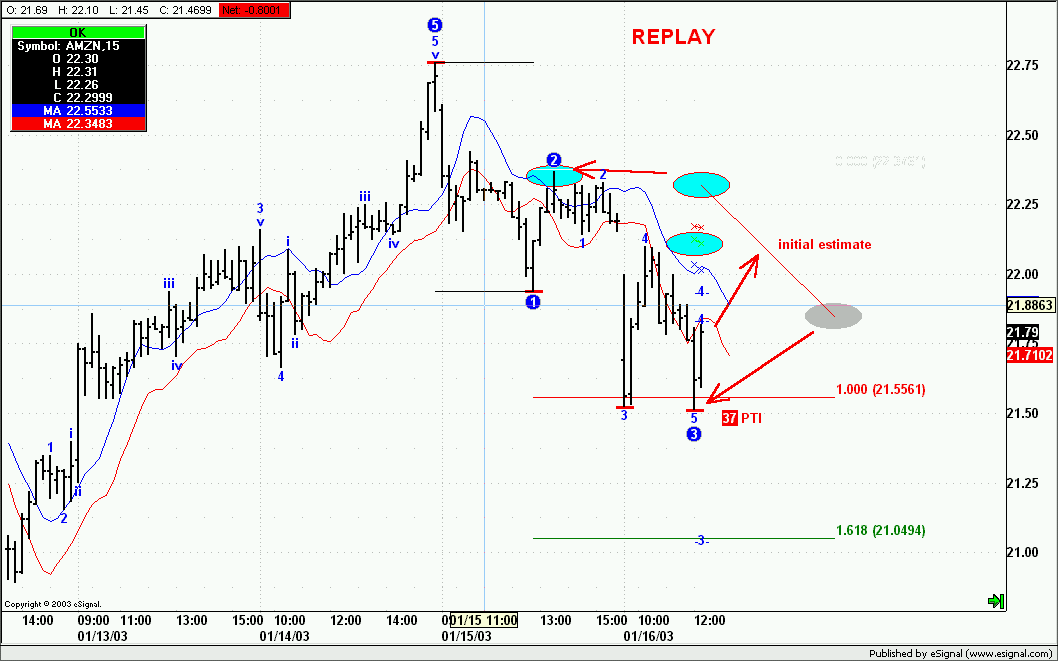
                        As you can see in the following image the Ellipse is giving us some interesting information even though it is still far away.
                        The shadow suggests this market has strong chances of reaching 22.11 approx and the Ellipse tells us that could be even higher.


                        Never the less we take the gamble and maintain the short.
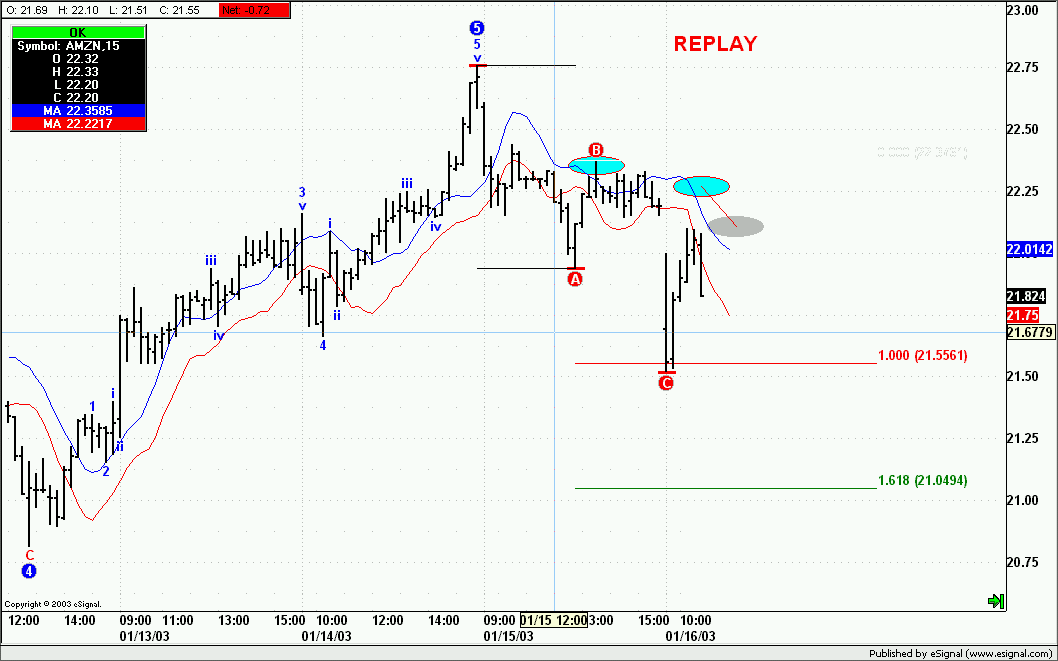
                        Here is what happened after some time. Prices went as high as 22.10 which is very much inline with what the shadow was suggesting and then turned downwards again with the Ellipse still well above. We maintain the short.


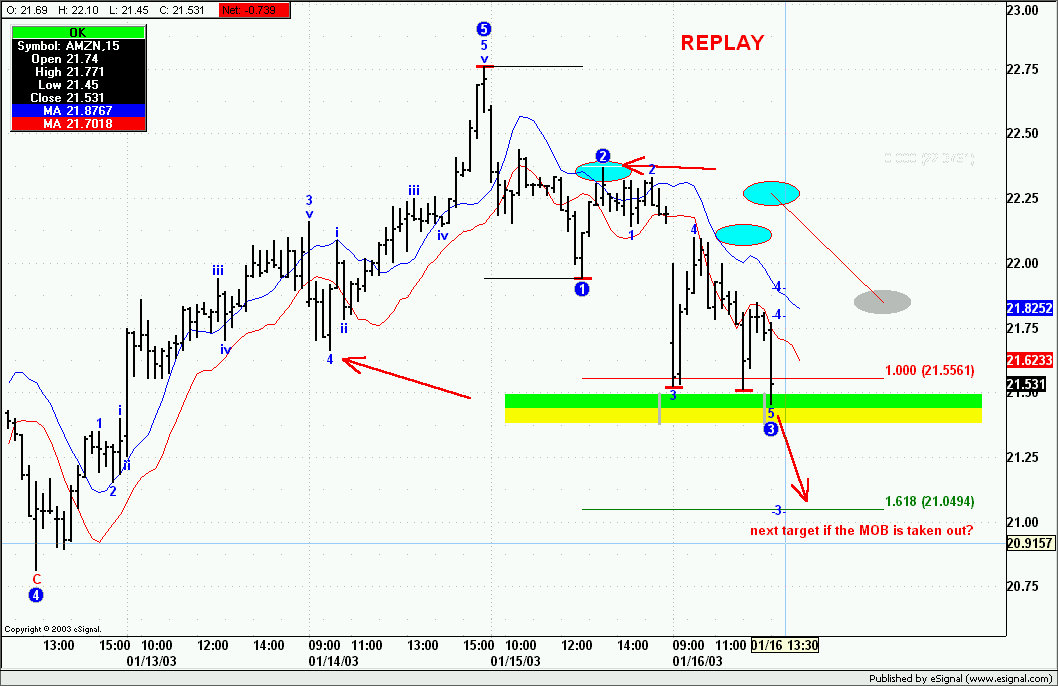
                        New low and we still want to maintain the short. Same procedure for a new protective Ellipse. Note that we also have a 6/4 channel that is giving us further protection.


                        And here is the situation as in the last 15 minutes. We have a MOB suggesting support and we are still in the general area of the original target.
                        We can elect to take profits and re-initiate the short on a close below the MOB or we can tighten our stops to the 6/4 channel or use another Ellipse possibly on a smaller swing to further reduce risk.


                        All this to show the variety of uses any of the tools Get offers.

                        Alex

                        Last edited by ACM; 01-16-2003, 12:57 PM.

                        Comment


                        • #27
                          OK, I'm starting to get the picture. So this AM, if I missed out on any opportunity on the 60 minute chart, I could have switched over to a 15 minute chart.

                          Based on the 15 minute chart, I could use ellipses to target a pullback and ride the wave...

                          Additionally, since the 15 minute chart has sub waves within the 60's W5->W5, **if** the 15 formed a W5 top, I could have also entered a short using the sub waves.

                          Correct?
                          Matt Gundersen

                          Comment


                          • #28
                            Yes, that is correct. You use the Ellipse and when necessary the lower interval[s] to take a lower risk trade in the direction of the predominant trend.
                            Alex

                            Comment


                            • #29
                              Alexis,

                              When using the ellipse and price enters it, what kind of rule do you use to decide if you should enter the trade?

                              For instance, in the picture below, the price went into the Ellipse @ the 2. At that point (waiting to go short) would you draw regression lines and wait for price to either cross the lower regressing channel or lower 3/1 MA?

                              Matt Gundersen

                              Comment


                              • #30
                                Adding another question to the questions...

                                Sample chart below in replay mode... What if the ellipse and price were to align up with the TPS 34 bar? I'm assuming that would further give evidence/confirmation to taking a potential short on a W4?

                                Matt Gundersen

                                Comment

                                Working...
                                X