Announcement

Collapse
No announcement yet.

The Ellipse

Collapse
X
 
  • Filter
  • Time
  • Show
Clear All
new posts

  • #31
    Another Ellipse Idea

    Hi Matt, Alex!

    Have you ever been day-trading on very short-term charts-- such as a 5 minute-- only to find yourself getting confused? I have.

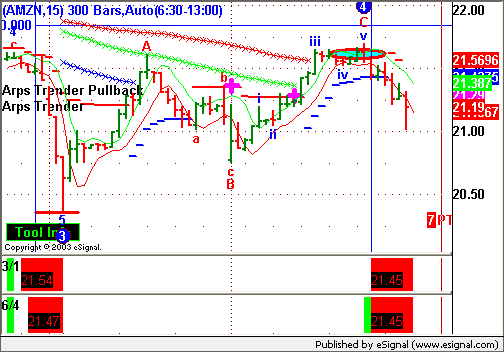
    One technique I use to compensate for confusion is to focus on AGET primary pivots when applying Ellipse calculations.

    I find TJ's Web and MOB's can, also, provide often additional day-trade support or resistance understanding.

    Attached is an Amazon, 5 minute chart to illustrate a little better what I mean.

    - Marc


    P.S. I appreciate your conversations. It is good reading. Keep up the excellent work!
    Attached Files
    Last edited by iliketype1s; 01-16-2003, 03:56 PM.

    Comment


    • #32
      That definitely shows support and resistance but doesn't answer the question - what is the entry rule when an ellipse, MOB, or Fib line is encountered?

      IMHO, it's insane to buy or short at a support or resistance point defined by the ellipse, MOB, or Fib. Definitely if price approaches or intercepts it there is supporting evidence for a trade.

      In my rule book though, price has to prove itself. And sometimes it goes through the support and resistance. When it does, sometimes it does bounce/reverse, other times it just keeps going through and beyond.

      That being said, I guess I'm asking what is the recommended "GET" style for entering the trade when price is bouncing off of a MOB, Fib, or Ellipse?

      For example, when doing a Type I or Type II, the recommendation is to wait for price to close beyond the MA (6/4), or regression line.

      For a long, In the case of it bouncing off of a MOB, Ellipse, or FIB, do you enter if price closes above the high of the previous bar? When it crosses a regression line drawn from Wx to Wx+1? Crossing a MA? There are a million and one ways to do this but is there one particular method that has stood the test of time and worked will in these particular support and resistance cases?

      So endeth the babbling...
      thx.m.
      Matt Gundersen

      Comment


      • #33
        …IMHO, it's insane to buy or short at a support or resistance point defined by the ellipse…

        Fear, Greed and Insanity - it's what drives the markets (Re: Matt Gundersen in "Trading the W3 -> W4" MMIII)

        Jokes aside while someone responds with the recommended setup/entry I will try to explain what I look for in the Ellipse and how I tend to make use of it.
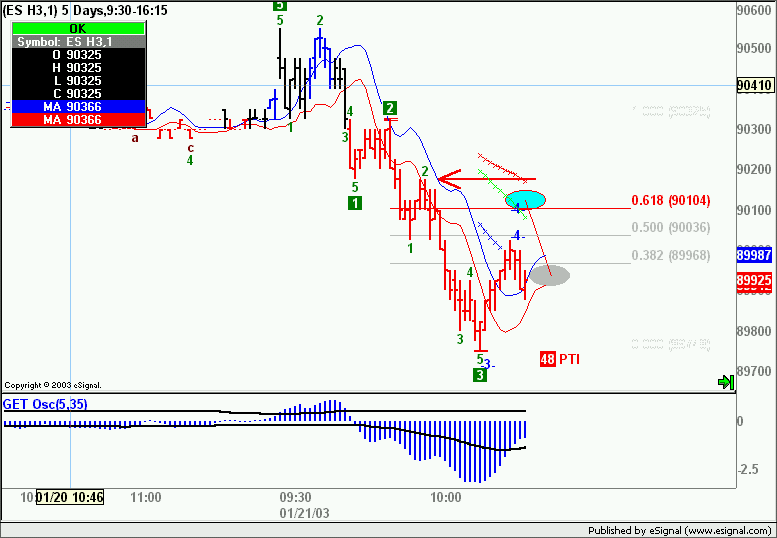
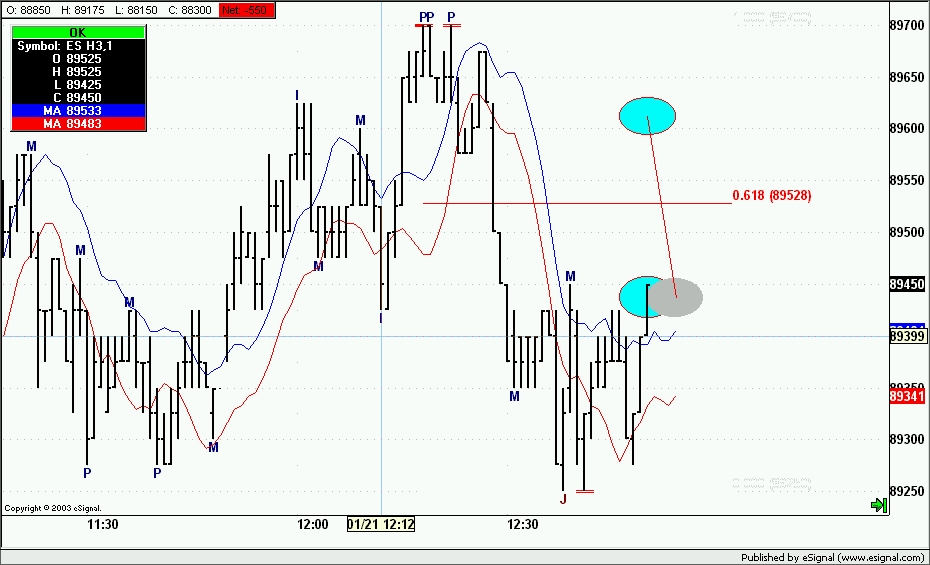
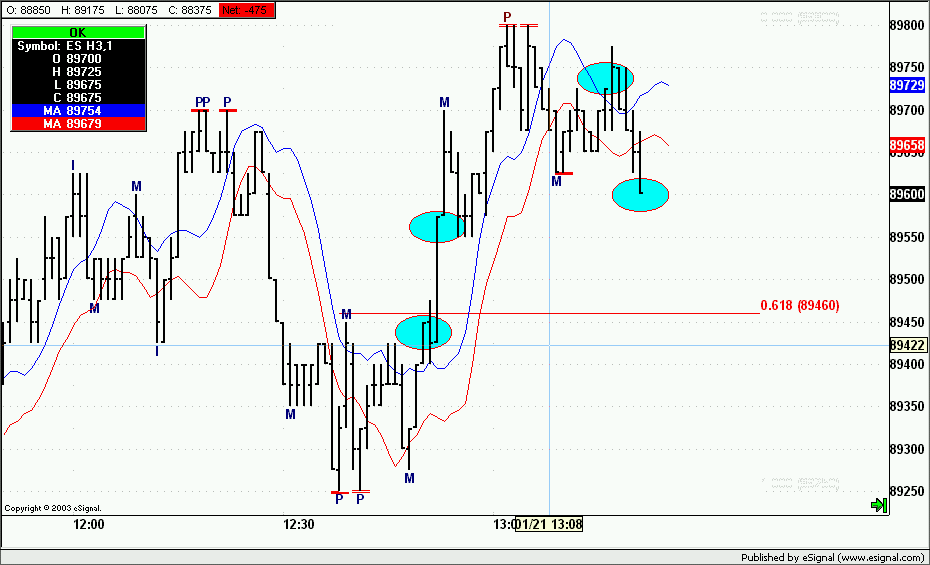
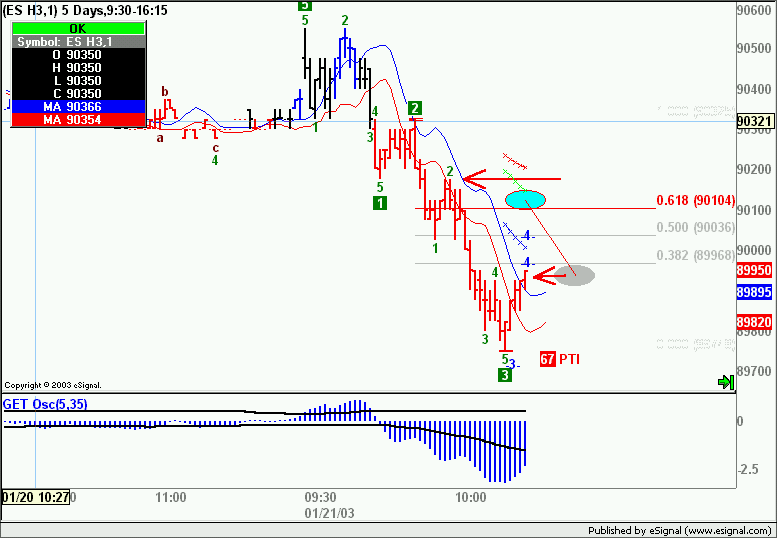
        As an example here is what I consider an almost text book case on 1 minute ES H3 this morning (and shown here in Replay mode).
        As you can see in the first image the market has made a low labeled as a wave3 by Get and then seems to reverse for a potential wave4.
        First thing I do is plot the Ellipse then a Fib Ret with the traditional values. Then I look for points where I could place a stop.
        The optimum would obviously be the highest swing from which this Ellipse is measured. That may or may not be always feasable so I also use 61.8 and (sometimes) 75% Fib Ret. In this case though I have a further intermediate point which is the end of wave 1 which as you can see converges with a small swing up. As I do not want an overlap that would be my ideal stop.
        In the mean time I keep an eye on the shadow and ensure that it is always in line with current price as it develops. That will tell me if this Ellipse is bound to be succesful or not
        Lastly I project the point of interception which is somewhere just above 900.00 (ie halfway in between the Ellipse and it shadow).


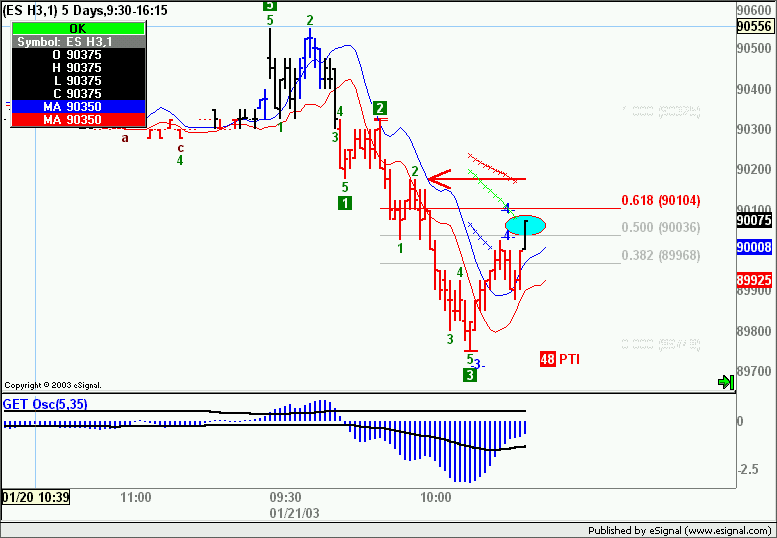
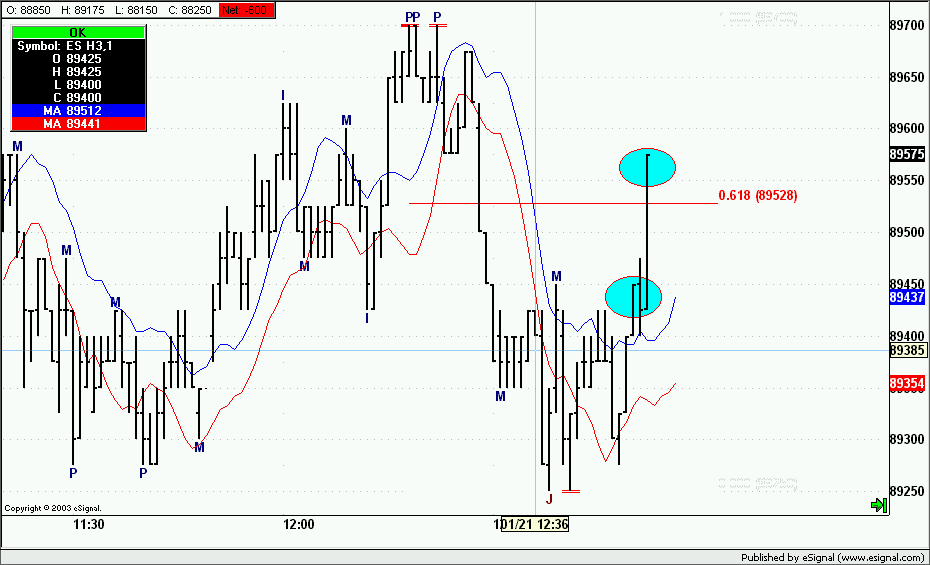
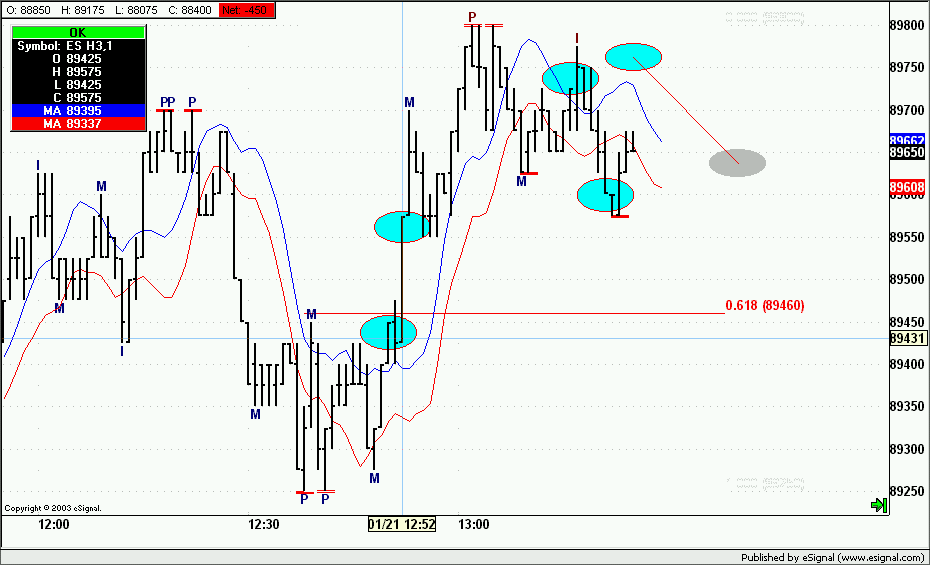
        In the next image you can see that the Ellipse has remained stationary, suggesting that this market will move higher while the shadow follows price in its iteration suggesting that the Ellipse may very well be timely.


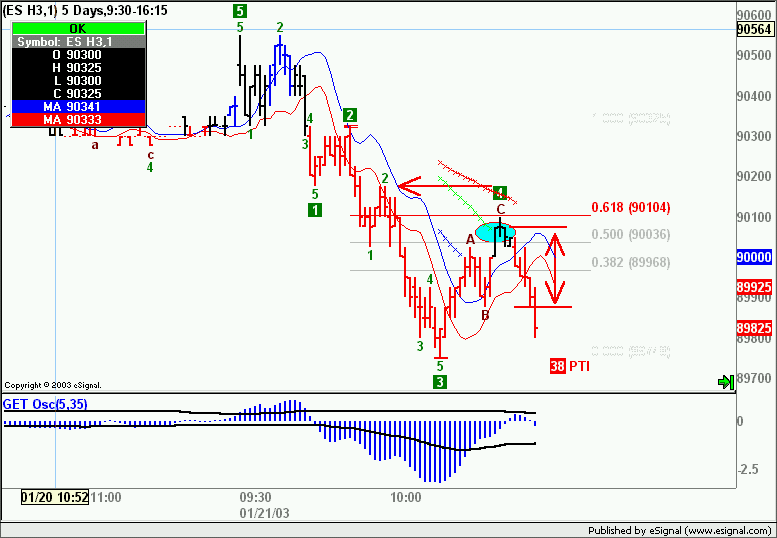
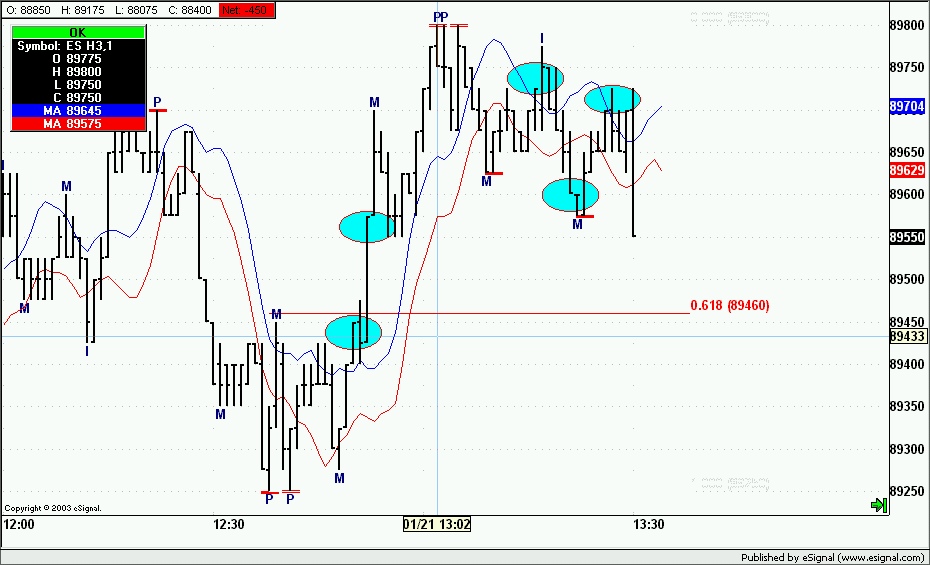
        The next screenshot shows the point of impact. The Ellipse and shadow have closed and triangulated perfectly with the market. Time and Price meet in this retracement. The daring (insane?) trader takes the short with stop what suggested above.


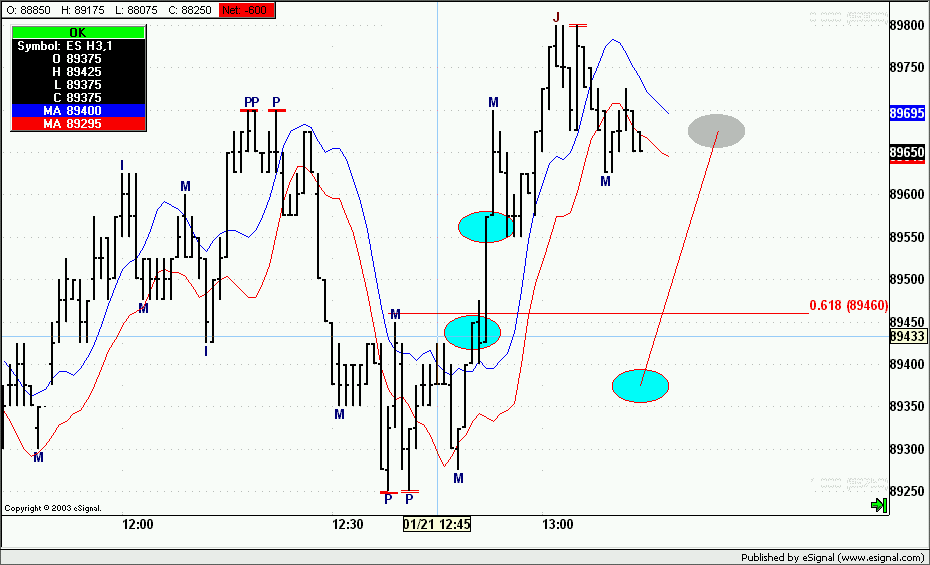
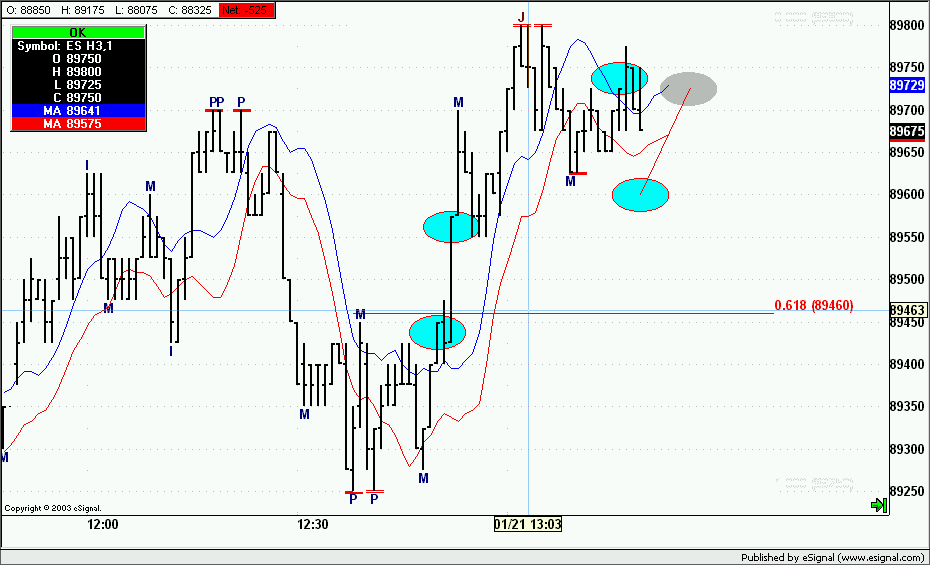
        The last image shows where one would have entered on the more traditional breakdown of the 6/4 and highlights the advantage that entering on an Ellipse offers. In this case almost 2 points which on a 1 minute chart is considerable. Furthermore the trade taken at the Ellipse at this point has no risk because the stop can be lowered to the price at the Ellipse (or protected already lower by using Ellipse on smaller swings).


        At this point if, I may, I would suggest that the best way to get acquainted and gain confidence with how the Ellipse behaves is to use a 1 min chart on a high liquidity instrument irrespective of the fact that one may or may not trade that interval. The point is that on a short intervals there are many swings available to use with the Ellipse and as I said in some earlier messages it is important to see how it works and how it tracks prices while it is happening because it does indeed offer many clues as to how it will perform.

        As to stops and entries a lot depends IMO on the kind of trading one is most comfortable with. Some traders will prefer a breakout/breakdown ie like you say they seek confirmation in price action. That is fine too but for me the object of the game with the Ellipse is to time my entry in the direction I want with the least amount of risk.

        And so endeth my babbling too…

        Alex
        Last edited by ACM; 01-21-2003, 11:43 AM.

        Comment


        • #34
          Sample chart below in replay mode... What if the ellipse and price were to align up with the TPS 34 bar? I'm assuming that would further give evidence/confirmation to taking a potential short on a W4?

          If the Ellipse will meet prices AND will be "locked" (ie the shadow and Ellipse have met) on that particular bar AND that bar also happens to be on the TPS 34 AND the potential upwards wave4 has the desired wave4 structure then yes I would consider it as a convergence of different tools and would certainly look for a short trade.

          Having said that I usually do not rely on absolute Time Projections.
          Disclaimer: I am not implying they have no merit rather that I don't personally use them. I know of a lot of cycle traders who are very succesful at using time projections and cycles as their main tools especially in connection with Elliott waves.
          In some ways I prefer a tool like the Gann Box that IMHO ties Time and Price in a more "structured" relationship.
          As to the Gann Box, Andy Bushak is IMO the person I would seek for an in depth write.

          Alex
          Last edited by ACM; 01-21-2003, 11:39 AM.

          Comment


          • #35
            Better example, combining AGET Ellipse with Webs

            Hi, hope you all had a great weekend.

            My apology, Matt, for last weeks post with Web levels on it. It was not a trade idea, just an attempt to introduce another AGET trading tool. Maybe later we can further discuss this tool and how using it can benefit your trading.

            For now, I am going to try to show an example of a potential short-term, day-trade Type 1 Sell setup idea using AGET TJ's Web levels and Ellipses as primary guides. Will add more tools and studies later if helpful in this example.

            General observations Tueday morning, 21 Jan 2003: Amazon bias today is down, weak in general. Oscillators weaker than previously. The stochastics displaying 'false bar' stochastics warnings for those trying to get long. A quick 'cross-referencing' to other time frames also supporting legitimate reasons to think short-term defensive this stock; encouraging for later aggressive sell ideas, in general. AMZN 15 minute is currently labeled a Wave 3 down. We are seeing red XTL's, and Wave 4 rally projections/Channels, PTI. Wave 4 tools are activated as guidelines when monitoring for Type 1 setups.

            TJ's Web levels used for today are defined from the Daily chart and then reissued to the chart you now see attached. Web's are being used in the 'Extended" mode for today because the price is already pushed outside the normal or reduced modes. AMZN has tested the support 'C' and 'D' levels today and are holding, increasing odds for some sort of a rally.

            I will try to update this idea later to show what happens, and to see if we could have easily identified later some sort of a Type 1 Sell opportunity.

            - Marc R
            Attached Files
            Last edited by iliketype1s; 01-21-2003, 10:30 AM.

            Comment


            • #36
              I know of a lot of cycle traders who are very succesful at using time projections and cycles as their main tools especially in connection with Elliott waves.
              Some types of cycle analysis does work amazingly well in conjuction with Elliott waves. Other forms of cycle analysis, not so much so. GANN Square of Price and time also tend to work very well with Elliott. All of this is IMHO of course.

              I want to thank all of the people for these posts. It's really interesting to see how others use these tools.
              Garth

              Comment


              • #37
                Updated on yesterday's Ellipse/Web comments

                Tue 21 Jan Follow-up: After posting AMZN 15 minute chart yesterday, the price rallied above the neutral zone to the green Wave 4 Channel where the Short Ellipse(s) also arrives. Aggressive day-traders would consider this a Type 1 Sell opportunity. If using yesterday's TJ's Web levels, the RA = 21.7883 price would become the focal point for any stop loss placement if selling short [yesterday] because if the RA and the Ellipse did not hold, it becomes a losing proposition.

                The Short Ellipse(s) arrival DID turn out yesterday to become the high price. AMZN drifted lower afterwards. It did not, however, sell off enough to justify carrying the position overnight.

                The Normal Ellipse (W1 begin to W3 end) still is active. Until this Ellipse arrives another Type 1 Sell setup is not a totally unreasonable desire. However, something is changing since yesterday. The PTI is now below 35. This means we are not experiencing 'normal' Wave 4 profit-taking. It serves as a warning to short sellers; the risk is greatly increasing for any new Type 1 Sell opportunity. You can take another Type 1 Sell, but the odds in favor of an easy, successful Type 1 Sell are quickly dropping. It tells me, if using just the Ellipse for a trading setup, you may end up in trouble. If you still desire to trade, you really must do greater homework, figuring out how you are going to manage the risk/reward on the next more risky setup.

                Using today's TJ's Web as a guide, monitoring the current Normal Ellipse placement, finding a minor MOB at the TJ's Webs upper range, knowing the Wave 1 and Wave 4 overlap rule-- it can still be a valid Elliott 5 Wave sequence so long as W1 and W4 do not overlap by more than a small percentage-- I am inclined to stand aside until AMZN rallies more today and shows some sort of a topping action.

                Will try to post later how all this works out.

                - marc
                Attached Files

                Comment


                • #38
                  Up to now almost all the examples of the Ellipse I have shown have been succesful ones. That is not always the case and there can be IMHO some interesting information that can be gained in observing when it fails. This is primarily due to a couple of reasons; first of all one learns to spot the signals that the Ellipse is constantly providing and secondly even when it fails the Ellipse can offer some indications of possible defensive strategies and follow-up trades.

                  For the purpose of this example I will not be using Elliott waves or anything else but will be using the Ellipse as a simple swing trading tool in conjunction with Pivots and the 6/4 channel.
                  In the first image we have an example of a low put in place and the opportunity for a continuation short trade.
                  As an aside here is a scenario that happens at times, where there are two equal highs/lows – both marked sometimes with the same Pivot strength - from which the Ellipse could be traced. As a general rule I tend to use always the first of the equal high/low for the starting point of the Ellipse and the last low/high for the ending point of the Ellipse. The reason I do this is that I consider those the points where the market turned. The difference is that the Ellipse tends to be a bit behind in time so if one is dealing with a market in a strong trend the Ellipse may not catch the contratrend move.

                  In this case in order to illustrate the difference I will plot two Ellipses one from each high Pivot. As I mentioned in an earlier message I will also plot a retracement with a 61.8% line as that is as high as I am willing to use an Ellipse and will use that as my stop.


                  As you can see the results are slightly different and so will the behavior. FWIW I have sometimes played the game where I will short one Ellipse and use the other as a stop but that has not proven itself as a worthwhile strategy (you will soon see why)
                  Anyhow, in the next image you see that the first Ellipse has now intercepted prices and the short trade is taken with stop at the 61.8% line.
                  If one were instead to apply Matt’s idea that prices have to prove themselves then one would wait for a breakdown of the 6/4 or the breakdown of a significant lower Pivot or the crossing of the Regression channel (any of the methods are valid).


                  This is what happened two bars later. Brutally stopped out on the trade (Matt’s concept proves right) and now we have the second Ellipse that has locked in place and intercepted price. However note that this Ellipse is well above the 61.8% so as far as I am concerned it should not be taken as you will see in the the following images.


                  At this point the only thing to do is to sit by the sidelines and wait until another significant swing trade opportunity presents itself which happens at the following image. Once again the only item I will plot is the 61.8% Fib Ret.


                  The market continues its course and we monitor it trying to catch that long. And here is one more suggestion. Just because one is seeking a trade in a given direction does not mean that one should not use Ellipses in the opposite to gauge the strength or weakness of a market. And that is eactly what is done here while waiting. The result is that we should be aware that this market has been rejected at the first swing up. No reason not to take a long trade but reason for concern and caution.


                  In the next image you see that the Ellipse has triangulated with price. We take the long trade with stop at the usual 61.8% Fib Ret. Matt instead will take it on a breakout of 6/4 channel presumably with a stop equal or just lower of whatever low will be put in place at the Ellipse.


                  Market seems to have now turned at the Ellipse and we immediately gauge the reaction by plotting another Ellipse from above to evaluate the strength of this reaction.


                  At this point the Ellipse from above is closed and warrants caution. This swing up is lower than the prior and I would tighten the stop to the low posted at the Ellipse. If this market wants to move higher it will have to breakout above this last Ellipse and the prior one else I might as well be out of this trade.
                  And here is where one can also think SAR with the Ellipse. If the lower one will be taken out one could either stop themselves out or SAR with a protective stop at the last Ellipse high.. Irrespective we are long and we wait.
                  In the next image we have a breakout setup of the 6/4 and the buy signal. Unfortunately also on the same bar the market goes sour.
                  Advantage – from my point of view - to the argument in favor of taking the trade at the Ellipse because the risk is now virtually non existant.


                  At this point – as said earlier – one is either stopped out or could take a SAR trade with stop above the high of the last Ellipse from above.
                  The alternative is now to look for resistance Ellipses to enter short trades. FWIW the market went downhill from this point ending the day on its lows.
                  As you can see even when an Ellipse ultimately fails it often does so in such a way as to contain risk.

                  I personally use 61.8 retracements as a general stop and to take/leave the trade, but that is also because I trade one specific instrument and have found that value to give good results across the intervals I use. I strongly suggest to experiment (especially now that Replay is available) with different settings and on different intervals. I would also suggest to take into consideration Matt’s idea that price has to prove itself and look at breakout/breakdowns following Ellipses versus taking trades on the Ellipses themselves.
                  Also I don’t use the Ellipse on its own, but in conjunction with other tools to provide me with low risk entries in the direction of the prevalent trend. This means that I would not have necessarily traded all the signals illustrated here unless they were in line with the analysis of higher intervals.
                  When I use Ellipse on longer intervals if the risk is too high to take a trade I immediately fall back to a lower interval seeking an entry suggested by an Elliott count and confirmed by an Ellipse. For example at the close of a wave 4 and with a wave5 in the works I will seek an entry on the lower interval wave2 of that wave5.
                  Lastly all I have posted on this subject over the course of these messages is just the result of my personal experience and is not representative of whatever recommendations eSignal/Trading Techniques may provide.

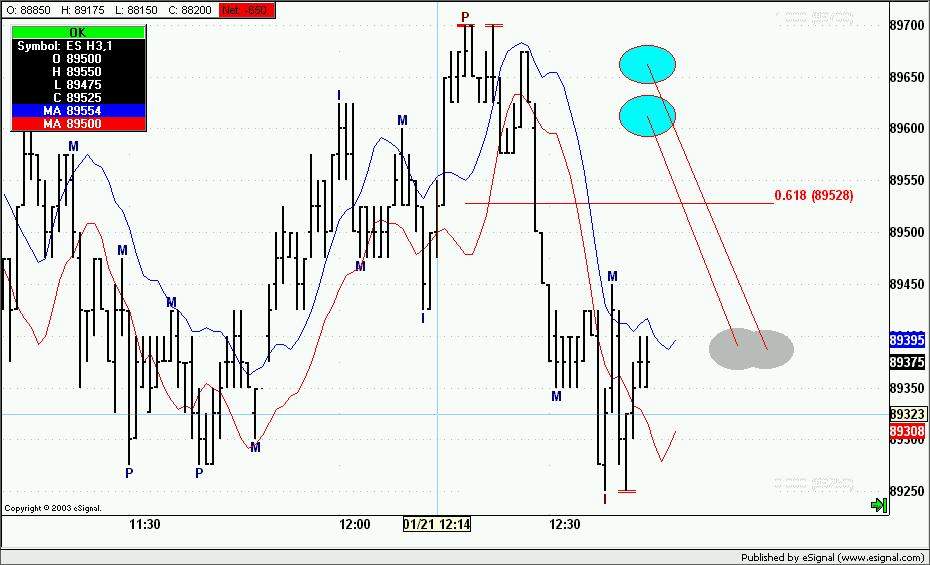
                  One final note. Also attached is a 3 minute chart where one can see the time period covered in this example (grey box). Notice that I have purposely selected a difficult point in the market ie one where it went into a trading range, thus further illustrating the merits of the Ellipse as a tool. I have also plotted the same Ellipse on the 3 minute chart to show the similarities.
                  Also notice that I have marked the areas where I would only look at short entries (red lines) and possibly long entries (blue lines). This is just to illustrate what I mean by using a prevalent trend.

                  Hope this helps

                  Alex
                  Attached Files
                  Last edited by ACM; 01-22-2003, 12:03 PM.

                  Comment


                  • #39
                    Marc, I'm looking @ your 15 min chart of Amazon and can't figure out how you got the Ellipse on the W4 of that chart. If I goto a 15 minute chart and draw an ellipse from the W5->W3, the ellipse goes much further out.

                    What timeframe was that ellipse drawn?

                    thx.m.
                    Matt Gundersen

                    Comment


                    • #40
                      Thank you, Thank you, Thank you Alexis.
                      Matt Gundersen

                      Comment


                      • #41
                        Matt
                        I am getting the same results as Marc (see attached). BTW the Normal intercepted perfectly what appears to be the C of wave4.
                        Are you using the 9:30-16:00 template?
                        Alex
                        Attached Files

                        Comment


                        • #42
                          using 9:30-16:00 (East Coast) template for AMZN 15 Minute

                          Hi Matt/Alex,

                          Yes, using the east coast template for 15 min AMZN chart.

                          Last Ellipse shown [taken from beginnning of Wave 1 and ending at the Wave 3 low]

                          Alex chart just shown same as mine, only with TJ's Web Levels added.

                          My SELL would have been the 'ideal' Normal Ellipse arrival, especially with the Wave "A" MOB [between the hash marks] resistance, initial stop loss above "RB (21.7613), or a hair above the MOB. Trailing stop strategy could be done in different ways depending on objective... will try to follow-up after close.

                          - Marc

                          Comment


                          • #43
                            Even using the 61.8% Fib Ret as a stop (as suggested elsewhere in this thread) would place it just above the MOB at 21.84.
                            Alex

                            Comment


                            • #44
                              And just today, we're all talking about the Ellipse. A prime example of using the ellipse and letting price confirm the action to enter the trade...

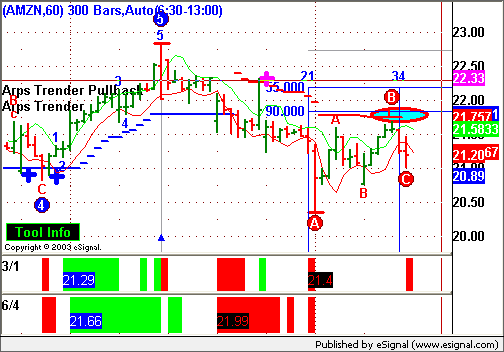
                              Looking at the 60 minute chart, I saw the A/B/C forming (not the major ones, the minor ones -- the ones that are not drawn in a circle). From this, I knew something was forming on a lower timeframe.


                              Based on Marc's comments about where the ultimate stop was (around 21.70), and since the Jan Arps tools (the Trender) were also confirming that, and the Ellipse was right there too, it sure liked like a nice low risk opportunity...... Switching over to the 15 minute time interval.... A W4 is formed with a nice opportunity....

                              Matt Gundersen

                              Comment


                              • #45
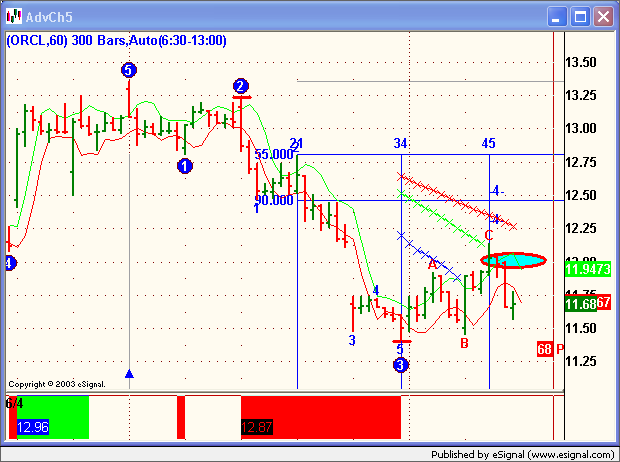
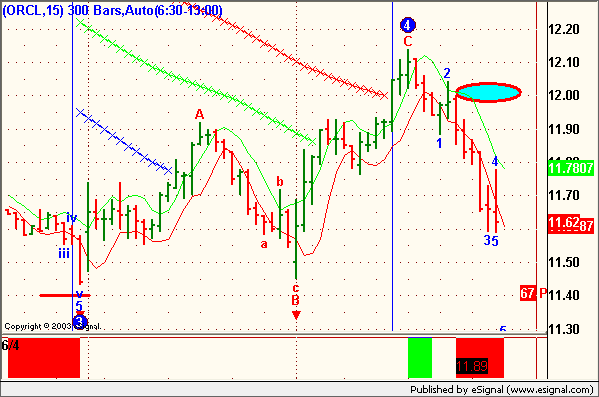
                                I'm also noticing ORCL demonstrated a nice Ellipse setup on the 60 today. It went into the ellipse as well as being near the TPS 45 based off the last major pivot/W5. Further putting the proof in the pudding...


                                Switching to a lower time frame, ala Alexis, for a better entry. Although the Ellipse drawn on the 60 doesn't align nicely on the 15, the 15 did have a nice W4 (Type I?) setup at the same time the 60 was tempting fate with the ellipse.

                                Matt Gundersen

                                Comment

                                Working...
                                X