Announcement

Collapse
No announcement yet.

Using AGET Parabolic as a stop Question

Collapse
X
 
  • Filter
  • Time
  • Show
Clear All
new posts

  • Using AGET Parabolic as a stop Question

    -----Original Message-----
    To: Rinehart, Marc
    Subject: AGET parabolic


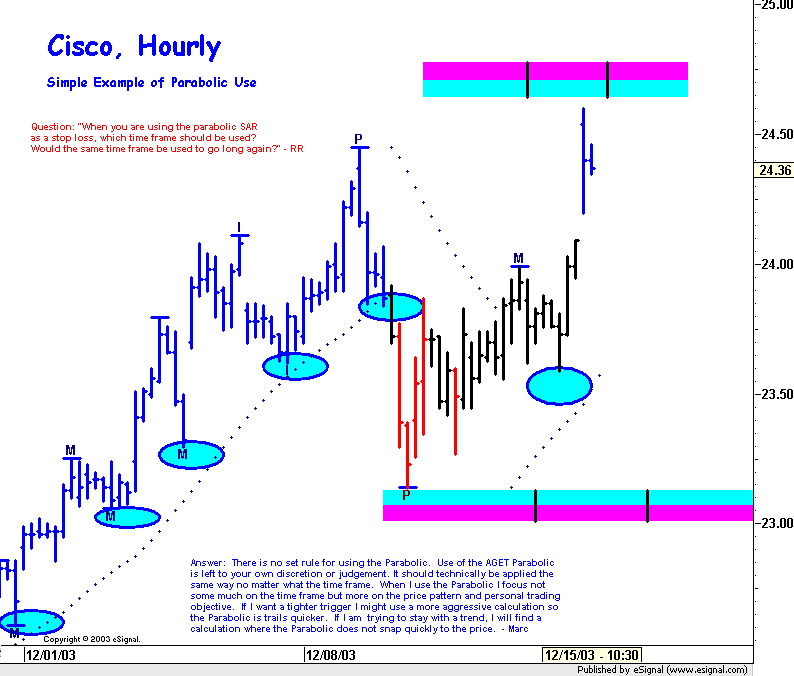
    When you are using the parabolic SAR as a stop loss, which time frame should be used?
    Would the same time frame be used to go long again? - RR

    - - - - - - - - - - - - - - - - - - - - - - - - -

    There is no set rule for using the Parabolic. Use of the AGET Parabolic is left to your own discretion or judgement.
    It should technically be applied the same way no matter what the time frame.

    When I use the Parabolic I focus not some much on the time frame but more on the price pattern and personal trading
    objective. If I want a tighter trigger I might use a more aggressive calculation so the Parabolic is trails quicker. If I am
    trying to stay with a trend, I will find a calculation where the Parabolic does not snap quickly to the price.
    Marc

  • #2
    Here is a Parabolic sample I am currently using with a stock named Cisco, on an hourly time frame....

    Marc

    Comment


    • #3
      Parabolic SAR

      Overview of Parabolic SAR

      The Parabolic SAR tool is from the work of Welles Wilder. Parabolic SAR is a display of "Stop And Reverse" points for a particular market.

      When the market touches or crosses a point, this indicates that you should reverse your position. In its most simplistic understanding, this means: if you are long, the Parabolic triggers a ‘go short’ reversal; if you are short, the Parabolic triggers a ‘go long’ reversal.

      The Parabolic SAR assumes that you are always in the market.

      Marc

      Comment


      • #4
        The Parabolic SAR gets its name because the stops resemble a parabola, or a "French Curve." It is a function of just not price, but time as well. The Parabolic SAR is designed to allow room for the market to react after a trade is initiated and then the stop is moved up rapidly.

        Marc

        Comment


        • #5
          The stop only incrementally moves in the direction that the trade has been initiated. How quickly the Parabolic SAR moves depend on the settings used.

          Marc

          Comment


          • #6
            The Parabolic is designed to be a true reverse system; every stop point is a potential reverse point. When the Stop is triggered it was originally intended to be an automatic reverse trade.

            Marc

            Comment


            • #7
              To help weed out the signals in a sideways moving market, some use the Parabolic SAR signals in combination with the ADX, so that only Parabolic SAR signals in the direction of the trend should be taken to open positions. If you are using the Parabolic SAR in this manner, then the close of positions by the Parabolic SAR are not to be taken as entry of reverse trades.

              Marc

              Comment


              • #8
                If you would like to learn more about this tool, check out Wilders book, "New Concepts in Technical Trading Systems." An additional source of information is provided in "Technical Analysis of the Futures Markets," by John Murphy.

                Marc

                Comment


                • #9
                  Advanced GET Parabolic SAR Menu Functions:

                  Acceleration Start: number box contains the number of the initial acceleration.
                  Acceleration Increment: number box contains the number that determines how much to increase acceleration over time.
                  Acceleration Maximum: number box contains the maximum amount of acceleration that can be achieved.
                  The Optimize button instructs GET to find the best acceleration values for the issue you are looking at. It does this by looping through thousands of combinations of variables until it finds the best set of variables that provide the most profit if you stop and reverse at every indicated point.
                  The Fine Tune button is similar in function to the Optimize button, except it takes the current values for the acceleration and makes more minute adjustments to the variables to find the best profit.
                  The Attributes Color: selection list allows you to select the color in which the Parabolic SAR will be drawn on the chart.
                  The Attributes Thickness: number box allows you to increase or decrease the thickness of the lines that are used to draw the Parabolic SAR. The lines get thinner as they approach the value of 1 and thicker as they approach the value of 5.
                  Press the Remove button to stop the Parabolic SAR from being displayed on the bar chart.

                  Marc

                  Comment

                  Working...
                  X