 Tweet
Tweet
Marcus How are you?
I pose you a reflection more than a question.
It arised by a discussion with a skilled gentelemen friend of mine
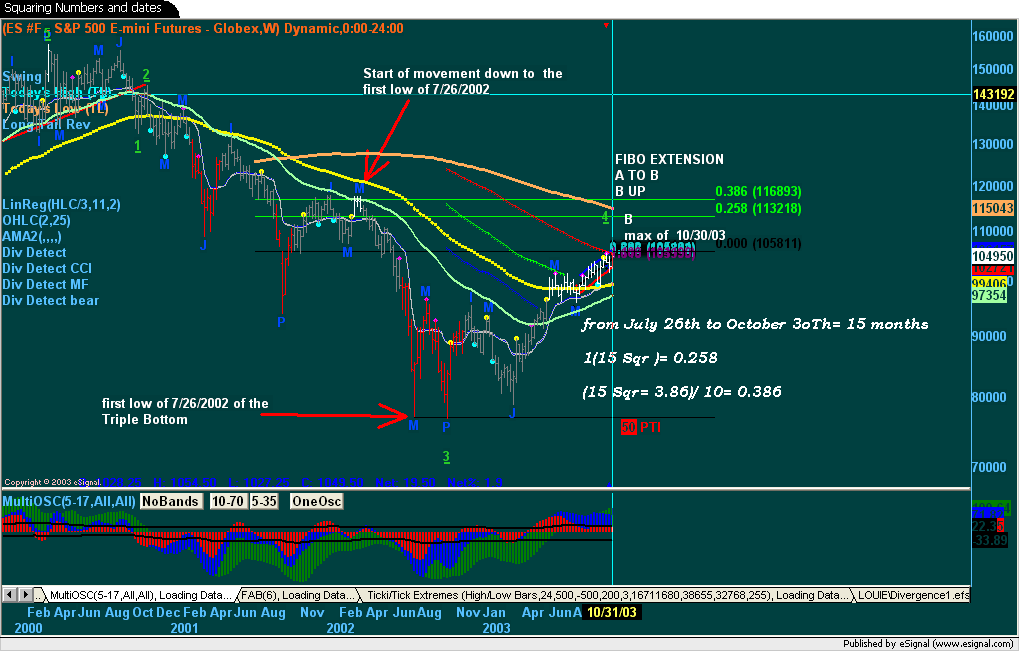
The Topic is TIME
Namely Time realtionship among price movement (retracements) of the same degree.
I use often the TJ 70% channel and this is it. It is working fine.
I'v tried to experiment something else: a .414 ( sqrt of 2 indeed) from a swing to another and actually it worked pointing a .618 and 786 good swing points in the future with good harmonic numbers in terms of bars.
But this is all and I stopped there, very much puzzled however.
Is there in TJ and your experience or AB etc..( to my humble knowledge there is none in the RN Elliot original writings) any clue for what concern such a time relation ratio/relationship?
A big hugh buddy, and greetings and all the best to you and your family
I pose you a reflection more than a question.
It arised by a discussion with a skilled gentelemen friend of mine
The Topic is TIME
Namely Time realtionship among price movement (retracements) of the same degree.
I use often the TJ 70% channel and this is it. It is working fine.
I'v tried to experiment something else: a .414 ( sqrt of 2 indeed) from a swing to another and actually it worked pointing a .618 and 786 good swing points in the future with good harmonic numbers in terms of bars.
But this is all and I stopped there, very much puzzled however.
Is there in TJ and your experience or AB etc..( to my humble knowledge there is none in the RN Elliot original writings) any clue for what concern such a time relation ratio/relationship?
A big hugh buddy, and greetings and all the best to you and your family
Comment