Announcement

Collapse
No announcement yet.

To Marc Time Relation In Price Movements

Collapse
X
 
  • Filter
  • Time
  • Show
Clear All
new posts

  • To Marc Time Relation In Price Movements

    Marcus How are you?

    I pose you a reflection more than a question.

    It arised by a discussion with a skilled gentelemen friend of mine

    The Topic is TIME

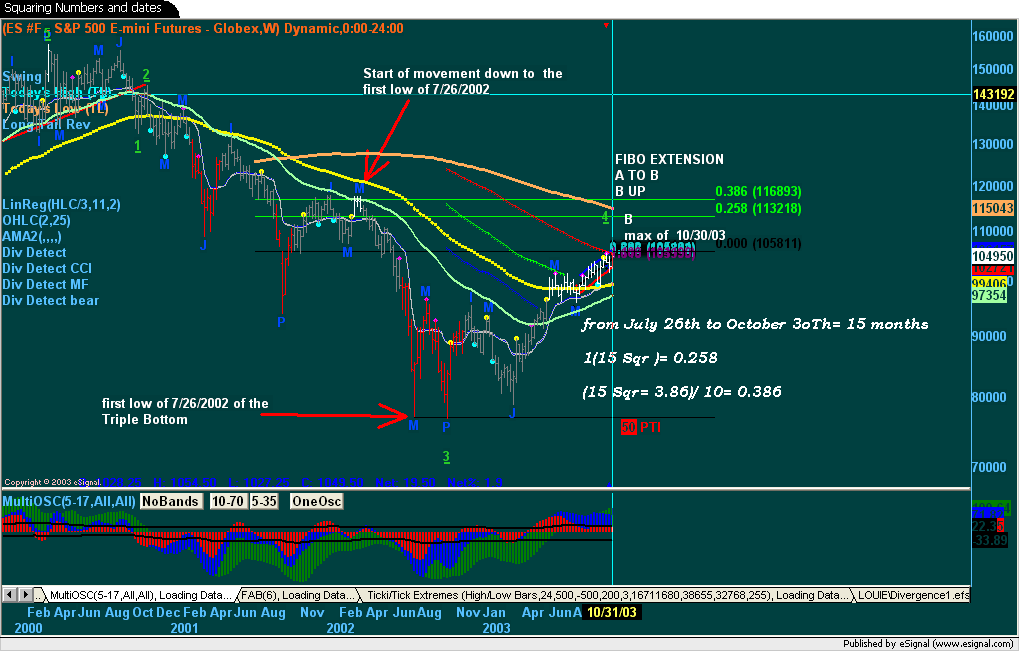
    Namely Time realtionship among price movement (retracements) of the same degree.

    I use often the TJ 70% channel and this is it. It is working fine.

    I'v tried to experiment something else: a .414 ( sqrt of 2 indeed) from a swing to another and actually it worked pointing a .618 and 786 good swing points in the future with good harmonic numbers in terms of bars.

    But this is all and I stopped there, very much puzzled however.

    Is there in TJ and your experience or AB etc..( to my humble knowledge there is none in the RN Elliot original writings) any clue for what concern such a time relation ratio/relationship?

    A big hugh buddy, and greetings and all the best to you and your family
    Last edited by fabrizio; 12-18-2003, 02:30 AM.
    Fabrizio L. Jorio Fili

  • #2
    Greetings Fabrizio,

    Happy holidays to you and your family too!

    You asked a really tough question. I am not sure I can answer it. Gann might provide more timing techniques then does Elliott Wave theory. After 15 years of work, I still am experimenting with finding better ways to more consistently, with confidence, better time a market.

    There is a relationship between time and price. Price is an easier variable to deal with then time.

    The problem I find between the two variables, price and time, price is a fixed variable for analyzing; time is not always a set-in-concrete variable. This is particularly true as we move into 24 hour trading. I (we) have experimented a great deal over the years with trying to better figure out ways to identify possible timing points. You have to ask questions like do you include day and overnight data in your timing calculation, or just day only data? Do you take only the most liquid time? Do you trade only US domestic exchange times or the exchange and time for the country you live in; or as a market trades around the world, do you combine selected exchanges time into a timing calculation? Do you include in a time calculation holidays or days the market might normally trade but are closed that day? Do you include all calendar days such as the weekend days, or just trading days? Should you only try to time markets that trade 24 hours? How do you account for the market illiquidities that occur daily at times which could somehow distort a 'timing' calculation? I tell you there still is no easy answer to the best timing method! There are people out there who will argue passionately on this subject. It is not in my nature to argue, but I still find trying to figure out the most appropriate 'timing' calculation still is not to be an open and shut case.

    I have met very few people who can time the market on a consistent basis. Basically after all these years what I do when I really want to build 'timing' considerations into an analysis is take a combination of our AGET Fibonacci and Gann based tools, and Cycles, and I over-analyze a chart to death until I am intuitively happy with the results.

    If you want to see one idea of how I might use one AGET tool for timing go to the Advanced User Group and review the Time and Price Squares Overview.(click here). I enter Fib, Gann, and other numbers as variables, and apply multiple T&PS applications from different key pivots. It is one of the simplest methods of checking for time considerations I have found.

    The bottom line: there is no one easy timing method that works consistently well, where you can have a very high degree of confidence it will generate in advance good results all the time.

    We have tried to build some timing mechanism into some of the more sophisticated AGET tools, such as the MOB and Ellipse, but I still think the timing mechanism of these algorithms has to place more weight on the price relationships within the data used for a calculation, and the timing mechanism tends to be limited to the immediate future time. It is a significant timing addition, but who is to say other combinations of data might provide better timing triggers in the future for what we are trading today?

    My approach to timing markets is more an intuitive approach, which is my strength. I will experiment with as much historical data as is available. Will apply timing tools from different pivots, experiment with different parameters until consistent patterns or favorable results are generated. Then I will use it to help me visualize the next timing possibilities.

    For now picking potential support/resistance price points still seems like a much easier proposition than trying to accurately time a potential pivot point using tricky timing techniques, at least until we can better solve our data related questions.
    Marc

    Comment


    • #3
      Marc

      Thanks for your answer aniway.

      I know (I guess) how to use T&P and FIBO TIME.

      I supposed there were room for a more articulate discussion about predefinite expriences - as a cite in my post.

      Again thanks for the time spent in answer .
      Fabrizio L. Jorio Fili

      Comment


      • #4
        .
        ... I supposed there were room for a more articulate
        discussion about predefinite expriences - as a cite in my post.

        Originally posted by fabrizio
        If there are others out there who would be open to sharing their ideas how they attempt to time the markets, please jump in and join this discussion as it could be very interesting. I will think this question over some more and try to figure out some chart illustrations to support what I was trying to say earlier. I am sorry I cannot answer better at this time.
        Marc

        Comment


        • #5
          fine
          Got the message loud & clear.
          Fabrizio L. Jorio Fili

          Comment


          • #6
            Something I'm programming into a neural network is this pattern. The price/time relationship with sqrt's and divisions of the circle. I start with the cycle low (1068 was a cycle low because it was a 50 retracement of the move from Dec 11 to top Dec 15) and find the sqrt of price and this gives all future time relationships. So the cycle study is 32.68 (exact pyrapoint calculations of price=time squared) with the channels. The yellow lines are my formula that is all time related. Take the 1068 price and multiply .0666 (24/360)=71.12,,, sqrt that to get price time intervals of 8.4. So the price intervals of 1076 and 1084 are a function of time (24 hours in the day/360 circle degrees) and work with my packing theory. If you would like to see more let me know, it get much more esoteric than this, but much more accurate.
            Attached Files

            Comment


            • #7
              Another time/price timing method is multiple pyrapoint squares. One at the big cycle of 1053 and the next at the small cycle high of 1082 ( the reason it's preconceived to be a small cycle is I have bigger picture work that says so and is my guide) but only use the channels. I use S&P cash because it's cleaner data to work with but if you know the premium and subtract the price you'll get it right for ES.
              Attached Files

              Comment


              • #8
                Re: To Marc Time Relation In Price Movements

                If you look at my charts Fab you see the pyrapoint up diagonal and down diagonal lines. By definition these are sqrt 2 levels to trade from. The square isn't the traditional square but a time/price relationship square and yields a true root-2 harmonic level that price is attracted to. The square root of 2 embodies a profound principle of the whole being more than the sum of its parts. (The square root of two equals about 1.414213562...) The orthogonal dimensions (axes at right angles) form the conjugal union of the horizontal and vertical which give birth to the greater offspring of the hypotenuse. The new generation possesses the capacity for synthesis, growth, integration and reconciliation of polarities by spanning both perspectives equally. The root of two originating from the square leads to a greater unity, a higher expression of its essential truth, faithful to its lineage.


                Originally posted by fabrizio
                Marcus How are you?

                I pose you a reflection more than a question.

                It arised by a discussion with a skilled gentelemen friend of mine

                The Topic is TIME

                Namely Time realtionship among price movement (retracements) of the same degree.

                I use often the TJ 70% channel and this is it. It is working fine.

                I'v tried to experiment something else: a .414 ( sqrt of 2 indeed) from a swing to another and actually it worked pointing a .618 and 786 good swing points in the future with good harmonic numbers in terms of bars.

                But this is all and I stopped there, very much puzzled however.

                Is there in TJ and your experience or AB etc..( to my humble knowledge there is none in the RN Elliot original writings) any clue for what concern such a time relation ratio/relationship?

                A big hugh buddy, and greetings and all the best to you and your family

                Comment


                • #9
                  Hi Chris

                  I believe that this kind of discussions lead to a interesting borders.

                  Thanks for picking up my doctrinal "provocation" Chris.

                  As a ,matter of fact what I was discussing with this skilled friend of mine was the finding of a almost constant patterns /ratio in time among the retracements.

                  By and large I do consider:
                  TIME,
                  PRICE
                  VOLUME in this order as the most important part of the trading. But Time is - evidently- the most complicated to rationalize (or maybe not?) .


                  We got exact ratios in fibo level for price retracements and I believe taht through the simple hints that you and me just outlined we could get to a better definition of the Time Axis.

                  AMOF the square of 2 and the SQRs of SQRS or the ((1-sqrs of ......)/2) brings to:
                  - interesting Time angolar ° values
                  - interesting time Fibo values.

                  You and me , we do not want to solve anything or reveal particular "secrets" or ask others to, but just open a open mind discussion about the TIME dimension.
                  That in my humble opinion is overwhelming the others factors.


                  Everyone that likes to add his idea, opinion or contribution is welvcome. Chris and I we actually revealed what we have discovered ( very simple as per mine) . if someone likes to add his two cents just in academic terms please chime in . We honestly have a TONS of hrs of studies, money, applications, relationships with others "tutors"; we do not like to " steal " anything to anyone nor make a "mucho mucho give away" like an old ads was saying ( as a matter of fact my T&p settings are covered everitime I post a chart with it ).
                  But is my deep believe is that this kind of discussion is not "per se" but it is a great gym for our minds and can makes each one learn more
                  Last edited by fabrizio; 12-20-2003, 01:04 AM.
                  Fabrizio L. Jorio Fili

                  Comment


                  • #10
                    Just to add to the timing element of trades, I began some time ago looking at computer driven models that "predicted" weather . like how does the weatherman know the rain will be here at an exact time when it's proven weather follows the chaos theory model. So deterministic chaos was the answer but how did that help me trading? As a trader my style is one of top and bottom picker, either based on price levels or time intervals based on astro (which in an of itself is extremly accurate) and always with a stop because this is chaos theory at it's best. So to build a model that took advantage of my style I thought of a way of detecting the extreme movement, but was based on time and not price. This in turn changed my style to include trend following in a guerilla warfare kind of way. How many times have you seen price jump so fast that you now know the trend but when you wait for the pull back it doesn't happen and you sit there watching easy money run away from you? I heard of an idea to use Doppler radar techniques ,from a fixed point in space and time, to gauge this movement and added statistical elements like past times price has moved like this. I also added certain number elements, like Fib, Gann numbers/circle divisions and So9 sqrt's and squares, and a relationship to other instruments like the bond market ,forex, options,and lately ETF's and news events and economic reports. The patterns I've found are astounding and they are all based on time, price is not a factor because the price will move no matter what it is, proof is any bubble that goes on longer than you think. Needless to say my new model I'm working on is based on the detection of time movement, as all radar systems are time sensitive . The slower the relay back to the source the the more likely I'm not in a trade but the faster the relay the more likely I am. Maybe this is totally off the wall with what your talking about and I'll say I'm sorry now. But if there are any software writers here or system programmers it's worth it to check into radar systems that include numerology and astro timing together. I know the astro may sound like I'm kooky but Dec 18 was a crazy day that I had 2 times that day, one was early in the morning, which I went long, and 2:20 CST for a possible CIT. The channel was defined that day and broke out of it at that time, so there is statistical significance to the astro timing. I waited for the channel to break either way and road it up that day. Anyways, this is my take on time.

                    Comment


                    • #11
                      The question is : there is a pattern in time?
                      Sub question is there is a time pattern among swings ?

                      The problem is not How to find it but if this pattern has a relevant statistical relevance as it is in FIBO PRICE.

                      SoTJ used an algorithm that introduce the TIME dimension in The shadowed ellipses. And all we are gratefull because is one of the most extraordinary tools in the world of trading.

                      WD Gann found it in commodieties ( likely ) through the astro cucle, but in agricultural commodities was somehow easier since they DEPEND heqavily ( namely in that historical period) by crops and crops by seasons. But no none knows where he found the pattern among a Swing and another in other securities.

                      In the ruels of the nature, in the rule of the moving planets, there is a Time pattern. In the rules of the PI (3.14) development of the decimals

                      Just Listen to this string ABACADABAC..................derived from the pattern of the PI ( not the PHI) and trasnlated in notes and played on a piano solo.
                      This is Time, armony, Not price. And It is in NATURE.

                      So whatever is the tool to affirm that in the financial markets ( and in the mass movement and behaviour ) there is a identifiable Time pattern, is more than welcome in this open mind discussion.


                      MUSIC FROM PI
                      Last edited by fabrizio; 12-21-2003, 03:09 AM.
                      Fabrizio L. Jorio Fili

                      Comment


                      • #12
                        Now that I hope you ahd the chance to listen to this music , let me note couple of things.

                        Who of you knows J.S. Bach? and who of you knows the " Canone eternamente ascendente"?
                        Bach was known for its "fuge". The "canone eternamente ascendente" is very close to waht is the PI muisic you listened.
                        Bach is known as a nusician but what shown intha t "canone" is one of the most incredible and remarkable mathematichal thing that a human person can perform mentally on an instrument : 12 fuges continuosly ascending and played by a single man by memory in total sinchronisms . In few words a spiral :
                        123456789101112 is the firts note string: once is finished the first will recommence starting from a higher level , whilst at the same time repeating the first one at the same tone and completing it .....and than the second and the first so forth almost endelessy.

                        Hence the name " Canone eternally rising"

                        This is what we called "autoreferencial logic" ( see Escher or Kurt Godel or the paradox of Zenone D'Elea)

                        Maybe all this has nothing to do with making money , BUT its is a microminimal step to verify that a TIME pattern xeist in nature . And in my opinion , should exist in Financial markets which are -eventually- the experssion of the mass behaviour.

                        I hope I haven't bored you . If I did it I apologize.
                        But latin says : Semel in anno licet insanire ( once in a year is permitted to be little crazy) and the year is almost over and I did not wanted miss my "slot".
                        Last edited by fabrizio; 12-21-2003, 06:17 AM.
                        Fabrizio L. Jorio Fili

                        Comment


                        • #13
                          Time patterns

                          There are time patterns in the markets but these are HUGE secrets. One hedge fund I know of has explored this exhaustively and they came to about the same conclusions I did. I laid out one time pattern before that WORKS, I don't know exactly why ,,,yet, but it can be shrunk down to intraday work.If you recall Fab there was a few times I said the market would go up, or that I was long after a huge downdraft, of that a price target would be hit, all these times were time only calculations. I won't get into great detail but I've said it before (and is very widely know techinque) that if you take a swing low to swing high, subtract the days and sqrt that, add 2 and resquare you get a pivot date. So low to high will give you another low date and high to low another high. Real world work, 9/30-10/15 is 15 days, sqrt that and add 2 then resquare to get 34.5 days. Add 34 days to 9/30 and get 11/03 or a swing high. Great amounts of money can be made with one contract just swing trading this technique so now you know why it's such a great secret. For instance 11/21 low to 12/03 high gives a date 12/21, today as a swing down day.So it would be prudent to maybe have a short bias now until the next date. The real work though is shrinking this to intraday work. What time frame? Count bars or hour or minutes? Add 2 or how about sqrt's? There are great results, in fact almost exact results but it takes many years for me to find this out and many hedgefunds as well so as they use to say on X-Files "the truth is out there" but you will have to explore this yourself. There are reasons for secrets, people just aren't ready to handle the conclusions.

                          Comment


                          • #14
                            Chris

                            I must admitt that I was 40% right and you were 80% right in market direction. Better: I took a huge swing down and you took a much bigger swing up. In Cycle terms.
                            I missed two huge forecasted bottoms in date and price well supported by geometrical and SQ9 hints.

                            However , nobody is perfect and I know your approach and highly esteem it.

                            Again the mistake was mine:
                            RN ELLIOT PRINCIPLE: ALL WAVES OF SIMILAR DEGREE WILL RELATE BY GEOMETRIC RATIO IN BOTH TIME AND PRICE"

                            If I only would have took a look to the prior same degree retracement wave I would ahve seen that 1.272
                            was hitting the absolute maximum in expansion by the prior altrenate Wave. So 1To1 relations was expected between the prior wave and this one, or in another words " there were geometrical relationship bet the two waves"

                            From all this again:
                            a) we have the tools to "read " the markets
                            b) very often we do not catch the whole picture but only one part. Often misleading.
                            c) the ratio is IN TIME IS there

                            A trader is often wrong , the market is never wrong.

                            In another case just by calculations( you rembere maybe the dark green chart) I got to the 1100 top retracement. It was too far for me to be realistic and instead we got very close to that . I did not believed my own calculations since they were not matching with my "feeling".
                            This is another proof that
                            a) you are right
                            b) the biggest trader enemy is himself...
                            Last edited by fabrizio; 12-23-2003, 09:31 AM.
                            Fabrizio L. Jorio Fili

                            Comment


                            • #15
                              here it was

                              Fabrizio L. Jorio Fili

                              Comment

                              Working...
                              X