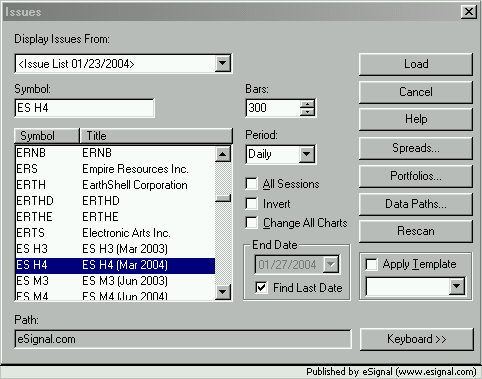
Does anybody know how I can get more than one stock or "Issue" onto a singler chart within Advanced GET ?
For example how could I plot Microsoft as well as a technology index or the S&P index each with their own moving averages etc.
I knoiw I can pull both graphs up and tile them but how do I get them on the same chart.
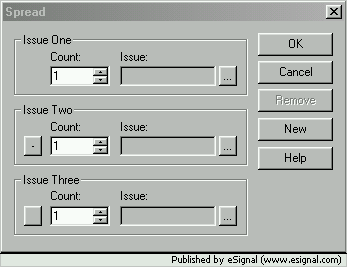
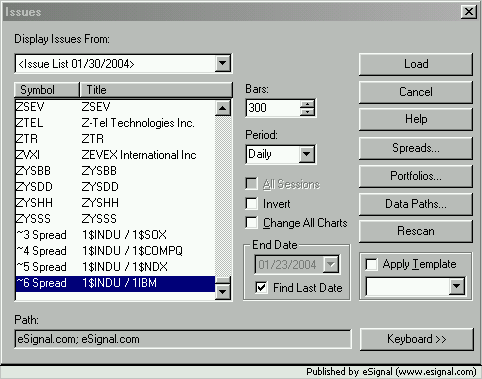
Also is it possible to build a spread graph between the two charts - say the difference between their closing prices ?


Comment