Announcement

Collapse
No announcement yet.

Multiple GET Charts

Collapse
X
 
  • Filter
  • Time
  • Show
Clear All
new posts

  • Multiple GET Charts

    Does anybody know how I can get more than one stock or "Issue" onto a singler chart within Advanced GET ?

    For example how could I plot Microsoft as well as a technology index or the S&P index each with their own moving averages etc.

    I knoiw I can pull both graphs up and tile them but how do I get them on the same chart.

    Also is it possible to build a spread graph between the two charts - say the difference between their closing prices ?
    Regards
    Philby

  • #2
    Philby
    You cannot create overlays with AdvancedGET standalone applications.
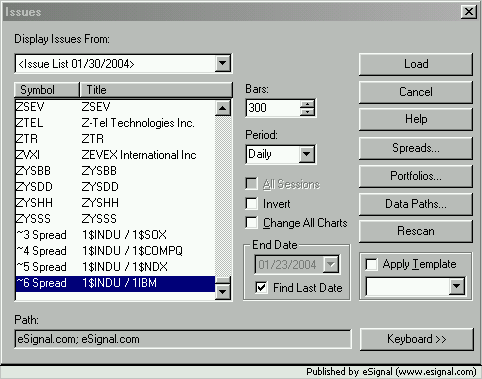
    With regards to creating spreads select File->New Chart (or click the New Chart icon) and in the Issues dialog box click the Spreads button


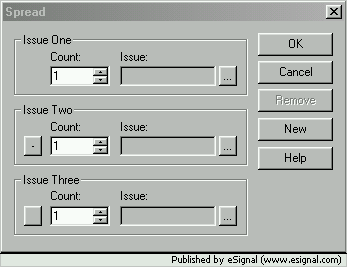
    This will open another dialog box.


    Select the first issue to be used in the spread by clicking the ... button in Issue One section. Then in the section for Issue2 select the operator to be used and the symbol for the second leg of the spread. Click OK and you will be taken back to the Issues dialog box with the spread highlighted
    Hope this helps
    Alex

    Comment


    • #3
      Spread analysis

      Alexis,

      Thanks for the guidance on spreads. I had taken a look at the section you referred to but was under the impression I could not use this method for getting the differnece between two equities/stocks.
      Regards
      Philby

      Comment


      • #4
        Spreads

        Alexis

        Tried a spread between the All Ordinaries ( similar to the S&P 500) and a stock I am looking to trade. It worked well - however I noticed that in EOD GET I could not name the spread and it appears that I can only have one at a time.

        Is this correct ? I would like to create a few spreads and save them asa page for later analysis - particularly if I am running a trade over a week or so.

        Originally posted by Alexis C. Montenegro
        Philby
        You cannot create overlays with AdvancedGET standalone applications.
        With regards to creating spreads select File->New Chart (or click the New Chart icon) and in the Issues dialog box click the Spreads button


        This will open another dialog box.


        Select the first issue to be used in the spread by clicking the ... button in Issue One section. Then in the section for Issue2 select the operator to be used and the symbol for the second leg of the spread. Click OK and you will be taken back to the Issues dialog box with the spread highlighted
        Hope this helps
        Alex
        Regards
        Philby

        Comment


        • #5
          Philby
          While you cannot name the spread yourself (AdvancedGET assigns its own name) you can have as many spreads as you want.
          Click the Spreads button again and it will come up with the last spread you created (or selected). Replace the symbols and click OK and you will see that it will create a new spread (see image).
          Alex

          Comment


          • #6
            Spreads

            Alexis,

            Thanks - wonder if a spread label or ability to name the spread like you can name a chart when saving it as a page would be a usefull programming change ?
            Regards
            Philby

            Comment

            Working...
            X