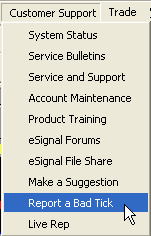
Are there any plans to fix the bad ticks that frequently occur on intraday Crude charts?
As an example, yesterday's pit session high and low in Nov Crude were 50.20 and 48.40. However, the 5min chart attached shows highs above this at 50.30 and lows at 48.30. (The yellow lines on the chart are the daily high and low).
The chart shown does have Tick Filtering enabled.
These bad ticks at the high and low of the day happen very often on Nymex intraday charts.
Thank you for your help on this matter.


Comment