Ah but wait, 0-24 h time template will not load symbols. Once the template is keyed to the time time zone, say Japan, it loads ok. The crash mentioned before still occurs. American symbols and indices are not affected.
Announcement
Collapse
No announcement yet.
Spread with Indices
Collapse
X
-
-
Anyway, back to the subject at hand. I was logged into eSignal on a laptop (both 8.0). I hit Ctrl-e. Data manager was closed, too. About five minutes later, I went to another desktop, opened eSignal. DM was red saying another user with same name still logged on. I shut it down, waited a few minutes. Started it again, this time it was green, only now, it complained I was using more than 200 symbols (ridiculous, more like 25), and there was a message saying they would be pruned at midnight. Fine, no problem, except that my spread charts now don't update in real-time, only once a minute. There is data now with the correct time template, but now having update problems. Will keep posted.Last edited by atlas; 08-23-2006, 09:16 PM.
Comment
-
atlas
There is an issue when using the 1! continuous contracts or spreads with a 24 hour Time Template set to 0:00-24:00 and as far as I know eSignal's developers are aware of this.
In the mean time you should be able to work around this issue by setting the 24 hour Time Template to 0:00-0:00
Alex
Originally posted by atlas
I guess the real question would be: why does an HSI chart show data starting at 0:00 and lop off the previous few hours (EST) when using 0:00 - 24:00 as time template yet show correct data when using HK template (21:45 - 4:15).
Comment
-
atlas
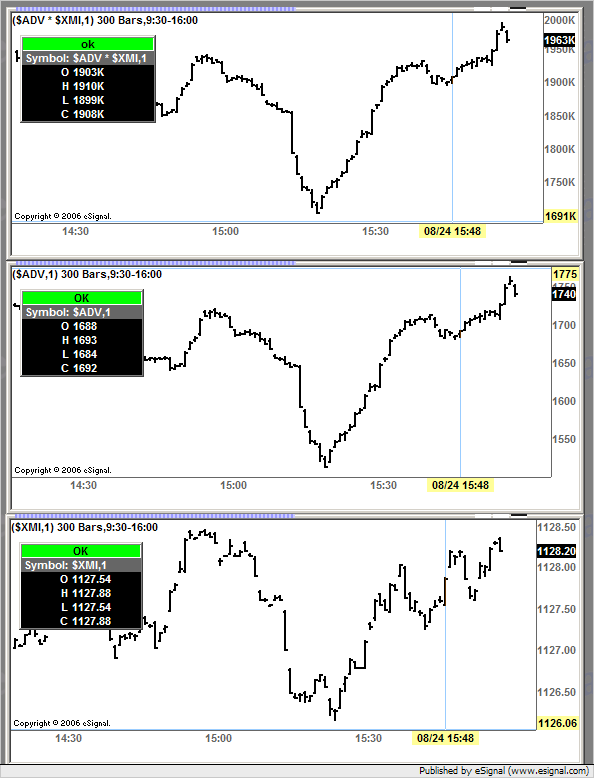
Here is what I am seeing on a 1 minute chart of $ADV * $XMI.

I manually checked the results over several bars and the values in the spread chart appear to be correct.
For example if you multiply the last values of $ADV and $XMI shown in the charts (ie 1128.20 * 1740) the result is 1,963,068 which in fact displays as 1963K in the spread chart.
As to the chart you posted the values of the price scale seem to match the one shown in my chart. However I cannot explain why your scale is displaying in exponential notation.
I am using version 8.0 build 779
Alex
Comment
Comment