This is kind of a dumb question, but I really need to know the answer to this...
I noticed it yesterday and don't know how it could happen???
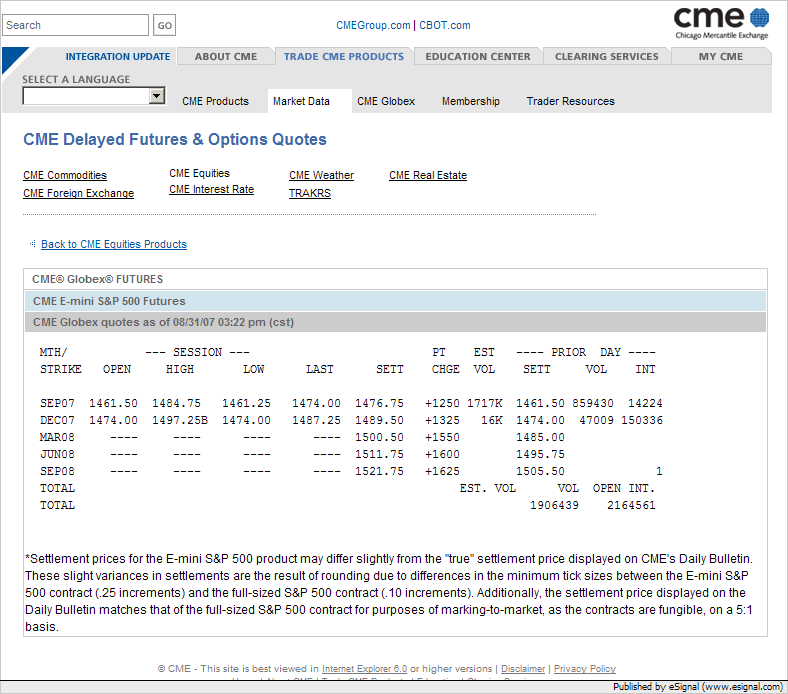
On the Daily Chart for the ES #F, the daily LOW shows as 1452.50
On the 5 minute chart, it shows the lowest point (in 24 hours) as 1452.50
THEY MATCH
But the OPEN are interesting....
On the DAILY chart is shows it opened @ 1461.5 (dynamic/0:00~24:00)
But the actual open @ 6:30AM pst was 1454.00 and the new bar at 0:00 hours opened at 1464.00??
TODAY"S Info...
Today, the Daily chart shows a low of 1461.25 and the 5 minute chart shows the lowest point of any trading today is 1467.75???
Now, these obvious issues with the data could be my fault with the time template or some other settings...???
BUT how can the low on the daily chart be 6 pts lower than the actual intra-day low for today?? This is really odd?

Comment