Announcement

Collapse
No announcement yet.

ES EOD vs. 5 MIN

Collapse
X
 
  • Filter
  • Time
  • Show
Clear All
new posts

  • ES EOD vs. 5 MIN

    This is kind of a dumb question, but I really need to know the answer to this...

    I noticed it yesterday and don't know how it could happen???

    On the Daily Chart for the ES #F, the daily LOW shows as 1452.50

    On the 5 minute chart, it shows the lowest point (in 24 hours) as 1452.50

    THEY MATCH

    But the OPEN are interesting....

    On the DAILY chart is shows it opened @ 1461.5 (dynamic/0:00~24:00)

    But the actual open @ 6:30AM pst was 1454.00 and the new bar at 0:00 hours opened at 1464.00??

    TODAY"S Info...

    Today, the Daily chart shows a low of 1461.25 and the 5 minute chart shows the lowest point of any trading today is 1467.75???

    Now, these obvious issues with the data could be my fault with the time template or some other settings...???

    BUT how can the low on the daily chart be 6 pts lower than the actual intra-day low for today?? This is really odd?
    Brad Matheny
    eSignal Solution Provider since 2000

  • #2
    Brad
    The daily bars of all futures always include all the trading sessions for the trade date and the Settlement.
    In the specific case of the CME e-mini equity index futures (such as ES, NQ, etc) there is only one trading session which starts at 15:30 CT (17:00 CT on Sunday and holidays) and ends at 15:15 of the following day which is the trade date.
    So the Open of the daily bar corresponds to the price traded at 15:30 CT of the day prior to the trade date and not to the price at 8:30 CT as this is not the official Open time
    The same applies to the High and Low values which include all of the trading within the session that starts at 15:30 CT of the day prior to the trade date and ends at 15:15 CT of the trade date.
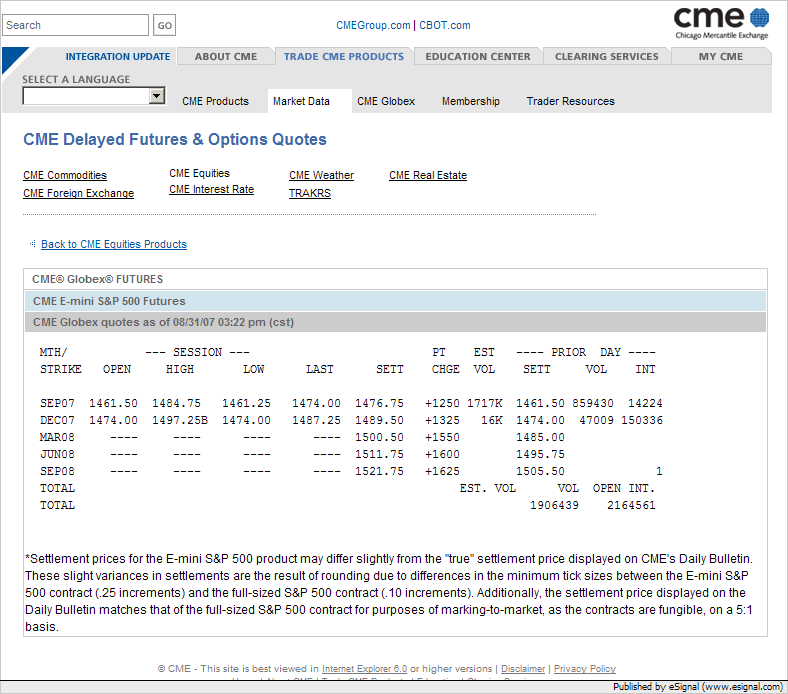
    As a confirmation that the values of the daily bar displayed in eSignal are correct see the enclosed screenshot which was taken directly from CME's site. As you can see the Open is 1461.50 and the Low is 1461.25
    Having said that eSignal provides for some futures a "synthetic" symbol which in the case of the CME emini equity index uses the pit session times of the equivalent full size contracts ie SP, ND, etc. To plot these symbols add an =2 extension to the original symbol eg ES #F=2. In this case the daily and intraday data will cover only the pit session ie from 8:30 CT to 15:15 CT
    Alex


    Originally posted by Doji3333
    This is kind of a dumb question, but I really need to know the answer to this...

    I noticed it yesterday and don't know how it could happen???

    On the Daily Chart for the ES #F, the daily LOW shows as 1452.50

    On the 5 minute chart, it shows the lowest point (in 24 hours) as 1452.50

    THEY MATCH

    But the OPEN are interesting....

    On the DAILY chart is shows it opened @ 1461.5 (dynamic/0:00~24:00)

    But the actual open @ 6:30AM pst was 1454.00 and the new bar at 0:00 hours opened at 1464.00??

    TODAY"S Info...

    Today, the Daily chart shows a low of 1461.25 and the 5 minute chart shows the lowest point of any trading today is 1467.75???

    Now, these obvious issues with the data could be my fault with the time template or some other settings...???

    BUT how can the low on the daily chart be 6 pts lower than the actual intra-day low for today?? This is really odd?

    Comment


    • #3
      Thanks Alex. I kinda thought I was missing something here and when my client asked about this I was at a loss to explain it.

      I assumed DAILY data would correspond to DAILY PRICE ACTION.

      You have proven the facts and I'm now able to reply to my client with factual information.

      Thanks again.
      Brad Matheny
      eSignal Solution Provider since 2000

      Comment


      • #4
        Brad
        You are most welcome
        Alex

        Comment

        Working...
        X