Announcement

Collapse
No announcement yet.

Volume is double what it should be.

Collapse
X
 
  • Filter
  • Time
  • Show
Clear All
new posts

  • Volume is double what it should be.

    Hello

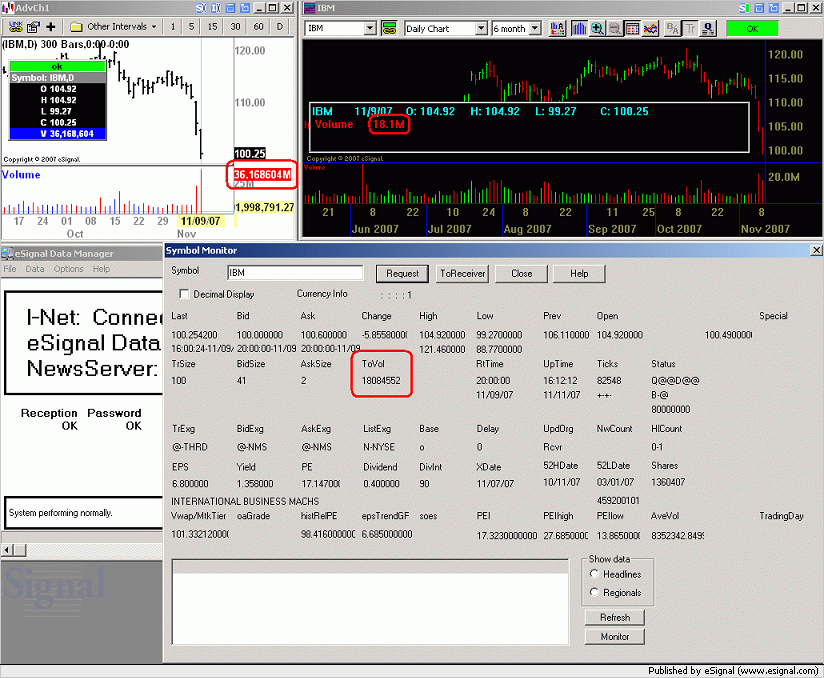
    I have been noticing since early last week that the prices and volume were incorrect on some charts. I have called several times ref # 6230881 to have this fixed. Today, saturday, the volumes for friday are all incorrect or double.

    -all Dow 30 stocks display 2x the normal volume for friday closing prices on an advanced chart...however, the quote window and standard chart display the data correctly.
    -All TSX charts display 2x the normal volume for friday closing prices on an advanced chart...however, the quote window and standard chart display the data correctly.
    -$indu and $tsx-tc display 2x the normal volume for friday closing prices on an advanced chart...however, the quote window and standard chart display the data correctly.
    -cl #f( I called about this on friday) display 2x the normal volume for friday closing prices on an advanced chart...however, the quote window and standard chart display the data correctly.
    gc #f, ng #f, sp #f, QQQQ, SPY, DIA etc, etc......everything I check turns up double the volume.

    -from wed-friday of last week I noticed some prices and volume would not update or were lagging while the quote window and standard chart were fucntioning perfectly, while advanced charting was not.
    -in the morning before the pre market all dow 30 stocks were showing incorrect volume but were corrected to the previous day volume once premarket trading is taking place.


    --I TOO have been noticing price spikes in individual stocks in different time frames that is very disturbing. usually I just go into bar editor and fix...however, it seems more and more stocks and futures have this error....GC #f was trading at $36,000.00 a few days ago on one price spike.

    Most traders need to see price and volume correctly before the day begins to make calm decisions. However, looking at any chart this weekend with these incredible spikes on an up/down day is impossible to make a wise trading decision.

    Possibly eSignal 10.0, the version I use, is the culprit as this never happened with the previous version I had. I was told on the phone that screen shots had been sent to the engineers as what I was seeing was being replicated on eSignal machines....however, after 4 days nothing has been done and the problem persists.

    When is this issue going to be fixed???

    Regards

    Pogman

  • #2
    $indu volume 0

    Hello

    further to my previous comment. My quote window and standard chart both show correct $indu volume at 11.14am but my advanced chart shows 0 volume??

    The rest of the symbols I checked seem to work in sync at this time. the YM #F volume and price work in sync with everything.

    Any ideas on when this is going to be fixed.

    Comment


    • #3
      Pogman
      The problem of the double Volume is due to a bug that was introduced in version 10 and occurs on the most recent daily bar when the History Servers (ie those that contain the daily or higher interval data) are updated at the end of the trading day.
      It is my understanding that eSignal's developers have been made aware of this issue but I do not have any knowledge as to when a fix will be implemented (that information will have to come from someone at eSignal)
      In the mean time a workaround to the problem is to refresh the chart using Ctrl+OK. Once you do that the Volume should be restored to its correct value (even if you close that chart and then create a new one for the same symbol). However once you restart eSignal the problem will reappear until you refresh the chart again.
      Alex

      Comment


      • #4
        Hi Alex

        Thanks for the response and the tech knowledge. What do you mean by Ctrl+OK?? Do you mean hold down the Ctrl button and press "enter"??

        Thanks

        Pogman


        Originally posted by Alexis C. Montenegro
        Pogman

        In the mean time a workaround to the problem is to refresh the chart using Ctrl+OK. Once you do that the Volume should be restored to its correct value (even if you close that chart and then create a new one for the same symbol). However once you restart eSignal the problem will reappear until you refresh the chart again.
        Alex

        Comment


        • #5
          Pogman
          I mean hold the Ctrl key and click the green OK in the Cursor Window. That will refresh the chart
          Alex

          Comment


          • #6
            Hi Alex

            I never knew that! Always a workaround with computers .

            Thanks for you help. Have a Great Day. You are the best around!

            Pogman

            Comment


            • #7
              Pogman
              You are most welcome and thank you for the compliment.
              You too have a great day
              Alex

              Comment


              • #8
                Hi Alex

                I have the same problem like pogman, but I'm not able to solve it with CTRL+OK. The chart is refreshing, but the double volume remain on the chart. I installed the newest version of eSignal (Build 859)

                Another question concern the futures daly volume (e.g YM). I found the following statement in the FAQ:

                Advanced Chart Window
                When looking at any electronic futures symbol on an intraday time frame the volume study will show you the actual contract volume being traded. If you are looking at any non-electronic futures contract in an intraday interval it will show you tick volume (tick volume is the number of times the price has changed in a given interval). If you are watching any futures symbol on a daily interval the volume shown will be yesterdays closing volume.

                The intraday volume shows the actual amount of traded contracts. Why is it not possible for electronic traded futures like YM to show the actual daly volume? To me, it seems nothing easier than to add all the traded contracts

                habi

                Comment


                • #9
                  habi
                  As far as I can see at my end using build 859 the refresh is restoring the Volume to its correct values with all the symbols I tried (which include indices, futures, stocks)
                  You may want to provide some symbols as examples so that I and/or someone else can test them
                  Alex

                  Comment


                  • #10
                    Hi Alex

                    I give you some examples:

                    $INDU, DIA, SPY, QQQQ, YM, ALTR, MSFT, APA, AKS, AA, HPQ ...

                    It's the same with all symbols. I tried with symbols never used bevor (and not cached). It is correct in the standard charting window, but not in the advanced charting window.

                    I was searching for clearing the cache, but haven't find something. I have no idea, what I can do.

                    habi

                    Comment


                    • #11
                      habi
                      I tested all the symbols you listed and at my end a refresh is restoring the correct Volume on each of them (see enclosed animation). FWIW I tried this on two computers with the same results.
                      At this point I cannot explain why this is not occurring at your end.
                      Alex

                      Comment


                      • #12
                        Hi Alex

                        Thanks for your response. I see and believe you, that it works, but not for me. I will send a message to eSignal, maybe we are on different servers.

                        Peter

                        Comment


                        • #13
                          Peter
                          As I explained in my reply to Pogman the issue of the double Volume is caused by a bug in eSignal version 10 (specifically a component of the application that manages the data for the Advanced Charts) and is not related to servers which are in effect providing the correct data. You can easily verify this by either opening a Standard Chart (which does not use this internal component) or by using the Symbol Moniltor in the Data Manager (which also is independent of the component) and you will see that in both the Volume is reported correctly. The enclosed screenshot shows the Advanced Chart reporting the double Volume while the Standard Chart and the Symbol Monitor are both displaying the correct value (as received from the server).
                          This still does not explain why a refresh is not working in your case. For that I would suggest that you contact eSignal's Support who are best equipped to determine what the cause could be and to provide a solution.
                          Alex


                          Originally posted by habi
                          Hi Alex

                          Thanks for your response. I see and believe you, that it works, but not for me. I will send a message to eSignal, maybe we are on different servers.

                          Peter

                          Comment


                          • #14
                            Hi Alex

                            Thanks for the additional informations. Yes, I sent allready a message to eSignal. If they know something more, I will post it here.

                            Peter

                            Comment


                            • #15
                              Peter
                              You are most welcome
                              Alex

                              Comment

                              Working...
                              X