Hello
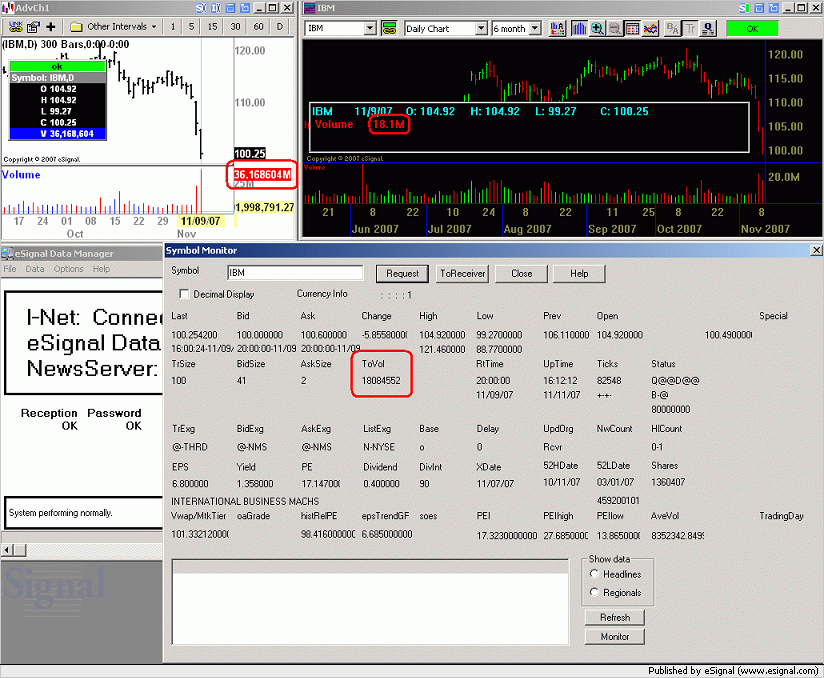
I have been noticing since early last week that the prices and volume were incorrect on some charts. I have called several times ref # 6230881 to have this fixed. Today, saturday, the volumes for friday are all incorrect or double.
-all Dow 30 stocks display 2x the normal volume for friday closing prices on an advanced chart...however, the quote window and standard chart display the data correctly.
-All TSX charts display 2x the normal volume for friday closing prices on an advanced chart...however, the quote window and standard chart display the data correctly.
-$indu and $tsx-tc display 2x the normal volume for friday closing prices on an advanced chart...however, the quote window and standard chart display the data correctly.
-cl #f( I called about this on friday) display 2x the normal volume for friday closing prices on an advanced chart...however, the quote window and standard chart display the data correctly.
gc #f, ng #f, sp #f, QQQQ, SPY, DIA etc, etc......everything I check turns up double the volume.
-from wed-friday of last week I noticed some prices and volume would not update or were lagging while the quote window and standard chart were fucntioning perfectly, while advanced charting was not.
-in the morning before the pre market all dow 30 stocks were showing incorrect volume but were corrected to the previous day volume once premarket trading is taking place.
--I TOO have been noticing price spikes in individual stocks in different time frames that is very disturbing. usually I just go into bar editor and fix...however, it seems more and more stocks and futures have this error....GC #f was trading at $36,000.00 a few days ago on one price spike.
Most traders need to see price and volume correctly before the day begins to make calm decisions. However, looking at any chart this weekend with these incredible spikes on an up/down day is impossible to make a wise trading decision.
Possibly eSignal 10.0, the version I use, is the culprit as this never happened with the previous version I had. I was told on the phone that screen shots had been sent to the engineers as what I was seeing was being replicated on eSignal machines....however, after 4 days nothing has been done and the problem persists.
When is this issue going to be fixed???
Regards
Pogman
 .
.


Comment