Hi
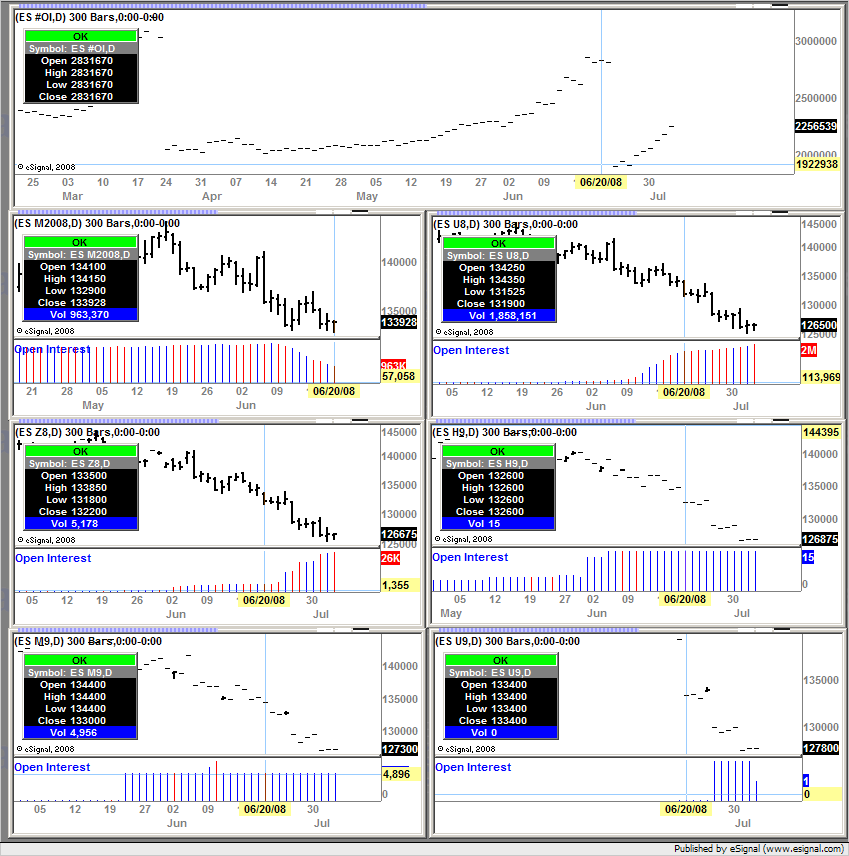
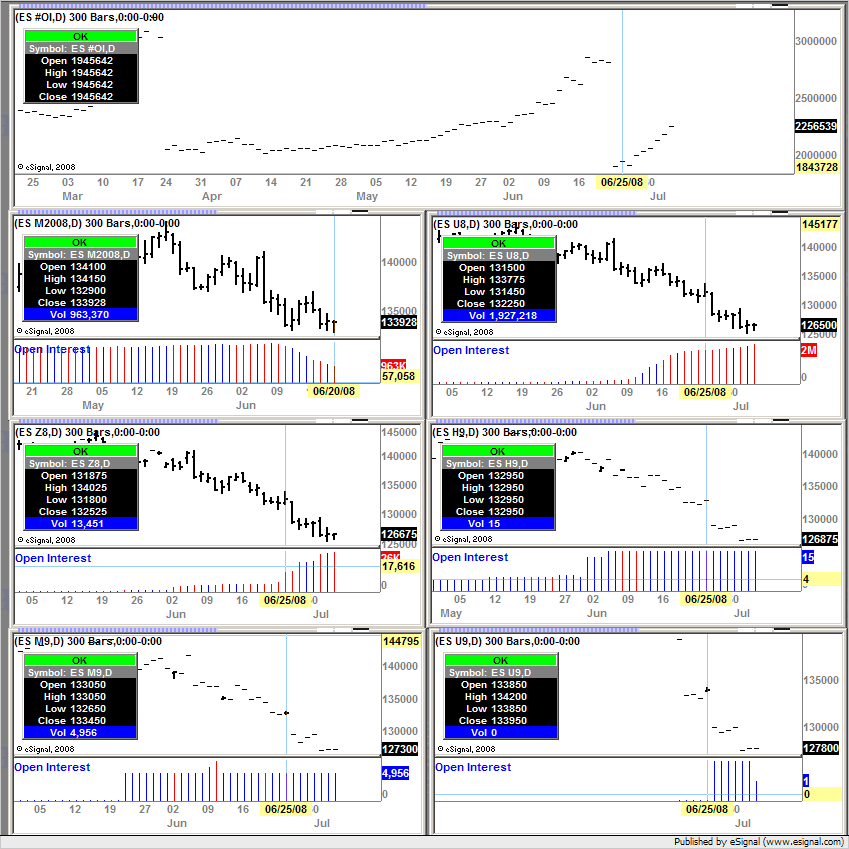
ES #oi (well, any "#OI") is described as an aggregated OI for all (calendar) contracts, now that sounds like a useful idea to me, easier than looking up the CME daily report thing.
So why on a daily plot of ES #OI for the last year or so do I see major discontinuities?
I see a slow rise to 2.5+m then drop to 1.7+ m every 3 months, drops seen mid Mar, Jun, Sep and Dec, now let me think, what happens then?
Am I miss-understanding "aggregated" here?
Thanks
Dave Turnbull


Comment