Announcement

Collapse
No announcement yet.

es #oi shows discontinuities

Collapse
X
 
  • Filter
  • Time
  • Show
Clear All
new posts

  • es #oi shows discontinuities

    Hi
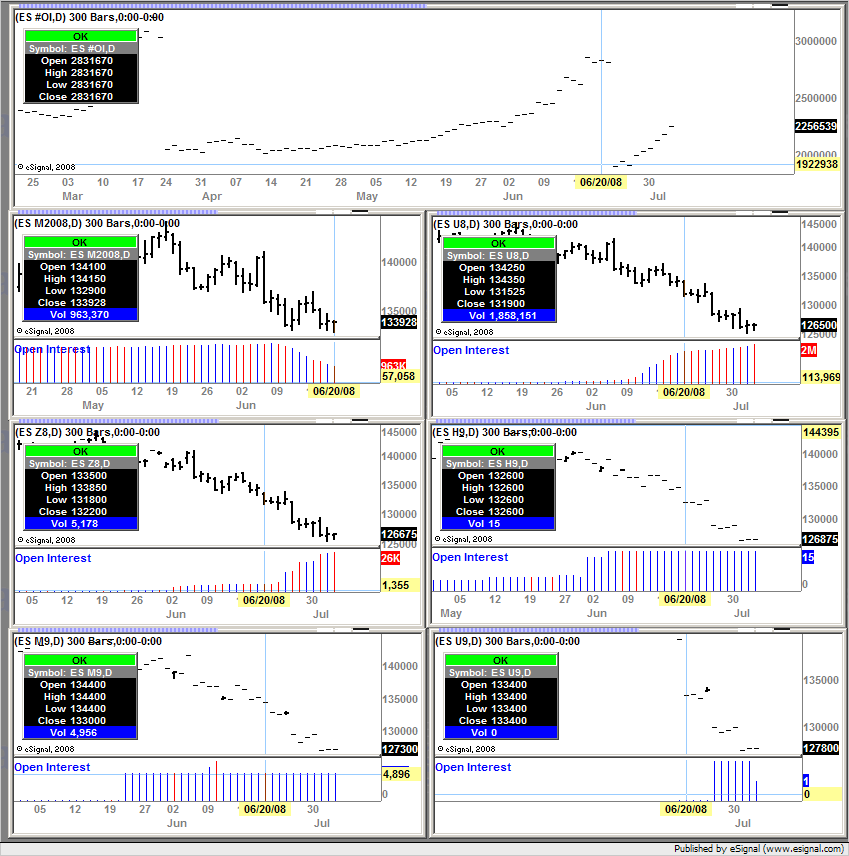
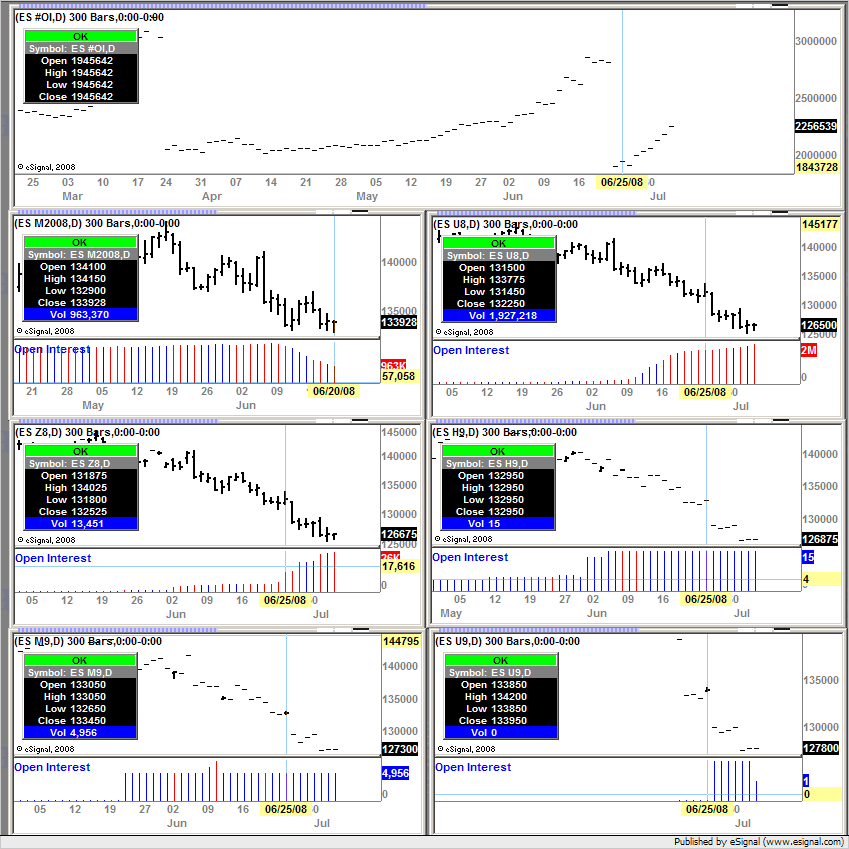
    ES #oi (well, any "#OI") is described as an aggregated OI for all (calendar) contracts, now that sounds like a useful idea to me, easier than looking up the CME daily report thing.

    So why on a daily plot of ES #OI for the last year or so do I see major discontinuities?

    I see a slow rise to 2.5+m then drop to 1.7+ m every 3 months, drops seen mid Mar, Jun, Sep and Dec, now let me think, what happens then?

    Am I miss-understanding "aggregated" here?

    Thanks

    Dave Turnbull
    Last edited by Dave180; 03-14-2008, 12:28 AM.

  • #2
    sample chart
    Attached Files

    Comment


    • #3
      this discontinuity still exists, and I still think it is unlikely to exist in reality (I would assume that there is no reason for aggregate OI to spike dramatically at a roll).
      Anyone have any ideas?

      Comment


      • #4
        Dave180
        I am not sure how you interepret "aggregate" but to me that means the total of all the Open Interests for the active contracts and other than for the fact that the "discontinuity" (as you refer to it) occurs one day late due to the way eSignal reports Volume and OI of futures I believe it does exist in reality.
        On June 20th for example the ES active contracts [5 months in the March quarterly cycle] were H8, U8, Z8, H9 and M9 with corresponding Open Interests of 963370, 1858151, 5178, 15 and 4956 for a total of 2831670 which is what is reported by ES #OI
        On June 25th (to completely bypass any afore mentioned issue due to how eSignal reports Volume and OI) the active contracts were U8, Z8, H9, M9 and U9 with the following OI values 1927218, 13451, 15, 4956 and 0 for a total of 1945640 which is 2 shy of the value reported by ES #OI (possibly due to some rounding). BTW you can also find all these same values in the daily Globex bulletins on the CME's site.
        In the enclosed screenshots I have positioned the cursor on June 20th and on June 25th so that all the OI values can be seen in the corresponding Cursor windows.
        Alex


        Originally posted by Dave180
        this discontinuity still exists, and I still think it is unlikely to exist in reality (I would assume that there is no reason for aggregate OI to spike dramatically at a roll).
        Anyone have any ideas?

        Comment


        • #5
          Alexis, Well thanks for looking at the individual figures. When I wrote the original post I just assumed it had to be wrong and as no one had said something like "it really does do that" I assumed there was still a data problem.

          Makes you think though, those 963K contracts that settle at $65k (@1300) a pop are $62,000M value, who does that flow between I wonder.

          Comment

          Working...
          X