Just want to make sure it's not just me:
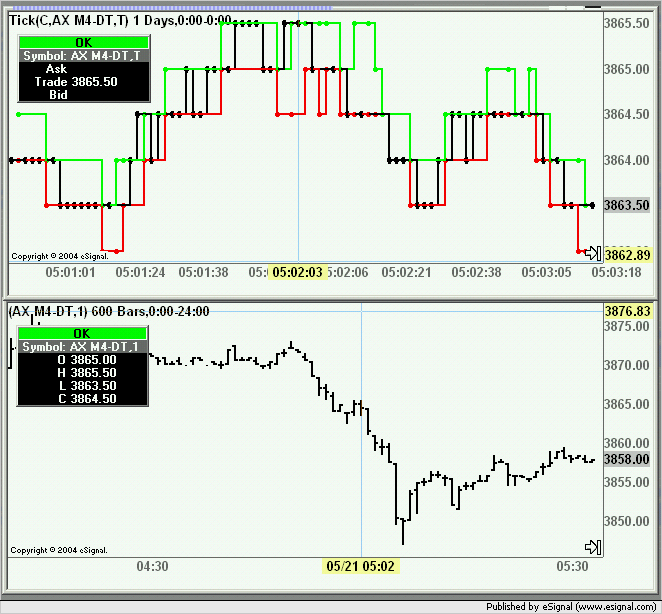
Open an advanced chart with DAX. Open a tick chart with DAX. Click the cursor crosshair for first chart. Change period to 1 min.
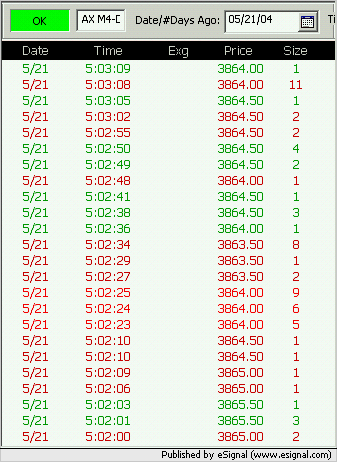
Move cursor to 05:03 EST on tick chart. The high looks like 3865.50. Look at where the cursor is on the min chart. It is stationed on 05:03, yet, the high there is only 3864.50. The 3865.50 highs occurred in 05:01 and 05:02 on the 1 minute. Is there a discrepancy of 1 min between the tick and minute charts?
-atlas


Comment