Greetings:
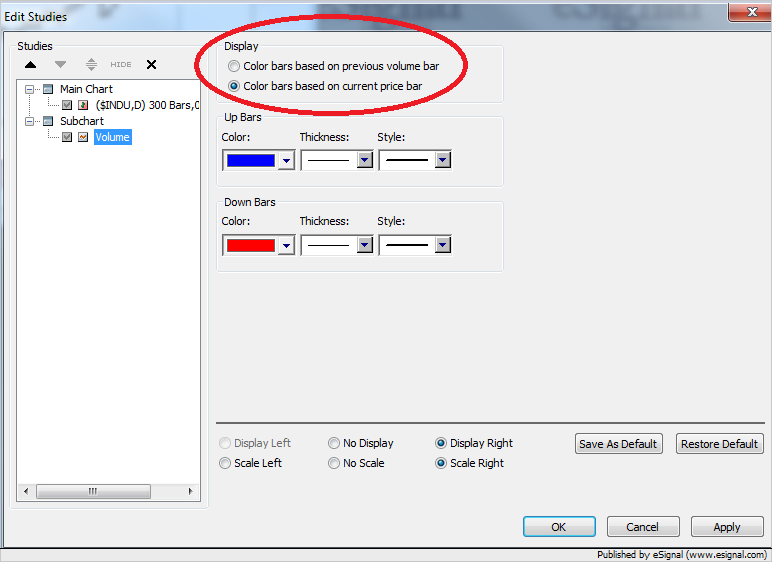
When I load the "volume study" from the Basic Studies menu into an advanced chart (for ES in this case), the histogram that is returned is a series of blue or red vertical lines. Is there a way to determine the conditions that dictate the color of each line so I can include those conditions in a study I'm writing, or is there a way to determine the color of each line that is returned in the "volume study"?
Thanks,
Warren

Comment