Announcement

Collapse
No announcement yet.

Missing Bars

Collapse
X
 
  • Filter
  • Time
  • Show
Clear All
new posts

  • Missing Bars

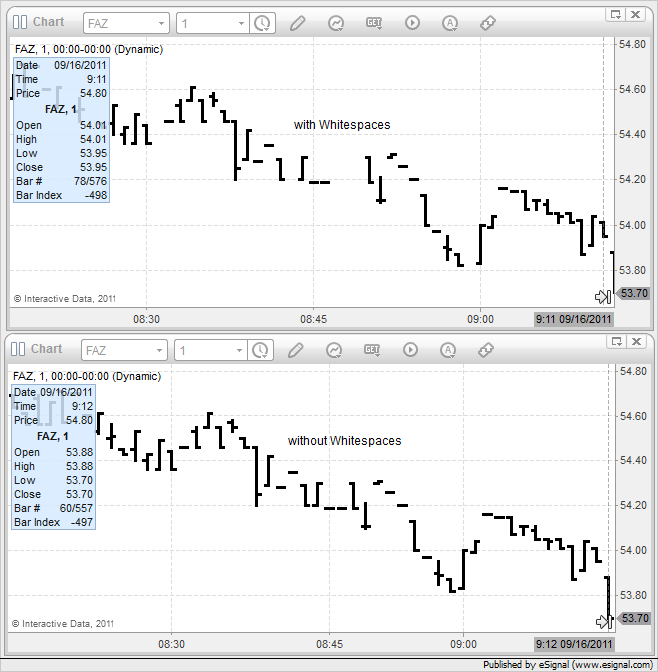
    This may have been mentioned before but I want to make sure it gets on the eSignal 11.2 "To Do" List. Sometimes when a bar is plotted the prior bar is not plotted and then it is re-plotted later which is misleading. This is shown in the image sequences.

    ~Bob
    Attached Files

  • #2
    Hello Bob,

    Thank you for the report, We'll test and try to duplicate the issue on Monday when the market is open. If we're able to duplicate it will be forward on to our Product Managers and Developers as a bug.


    AveryH
    eSignal Support

    Comment


    • #3
      Hello Avery,

      Off Topic so please delete after reading.

      I noticed that you deleted my second post in this thread (which was a modified original) which is fine but all I wanted to do was edit the original post so that the first line was more readable by not running over the "Edit" & "Quote" tabs but it turns out this is impossible for the user to do. In the future I will make the first line short but it would be nice to always be able to "Edit" the post regardless of the length of the first line.

      As a second issue I have not been receiving posts by e-mail in real time since the beginning of September.

      Thanks,

      ~Bob
      Last edited by bobscott; 09-16-2011, 05:25 PM.

      Comment


      • #4
        Bob

        Originally posted by bobscott
        As a second issue I have not been receiving posts by e-mail in real time since the beginning of September.
        See this post for the reason
        Alex

        Comment


        • #5
          Thanks Alex - I guess I missed the post .

          Hi Avery,

          The "strange" plotting problem is best noticed in pre or post market when trades are farther apart. I just went to "Historical" data so you could see the time that I noted this and I found another problem. Note that the "Real Time" chart shows a gap in data between "08:46" and "08:50" but this gap is lacking in the "Historical" chart. It seems to me that a 1 minute chart should look the same both on "Real Time" and "Historical" charts.

          Thanks,

          ~Bob
          Attached Files
          Last edited by bobscott; 09-16-2011, 07:30 PM.

          Comment


          • #6
            Bob
            FWIW if the images you posted are of different charts then it seems that you may have one of them set to use Whitespaces and the other not [see in Properties-> Scales]
            Alex


            Originally posted by bobscott
            Thanks Alex - I guess I missed the post .

            Avery,

            The "strange" plotting problem is best noticed in pre or post market when trades are farther apart. I just went to "Historical" data so you could see the time that I noted this and I found another problem. Note that the "Real Time" chart shows a gap in data between "08:46" and "08:50" but this gap is lacking in the "Historical" chart. It seems to me that a 1 minute chart should look the same both on "Real Time" and "Historical" charts.

            Thanks,

            ~Bob

            Comment


            • #7
              Originally posted by Alexis C. Montenegro
              FWIW if the images you posted are of different charts then it seems that you may have one of them set to use Whitespaces and the other not [see in Properties-> Scales]
              Alex
              Alex,

              Good question. In actuality neither of the charts have "Whitespaces" checked so I guess the "Historical" chart is correct and indeed the "Whitespaces" are shown if the "Whitespace" is checked. This chart was made from a single chart using the "Duplicate Window" function. The "real Time" Chart was taken from a chart which has 3 symbols inserted and it looks like that assumes that the "Whitespaces" is checked. Actually, there are a few problems with the multiple symbols chart so this may just be a "wait awhile" thing.

              Thanks,

              ~Bob
              Last edited by bobscott; 09-16-2011, 08:24 PM.

              Comment


              • #8
                Bob
                Whitespaces are added [even if the option is unchecked] when you have multiple symbols and/or intervals and the bars of any one of them does not match the exact timestamp of the others else they would end up misaligned or missing
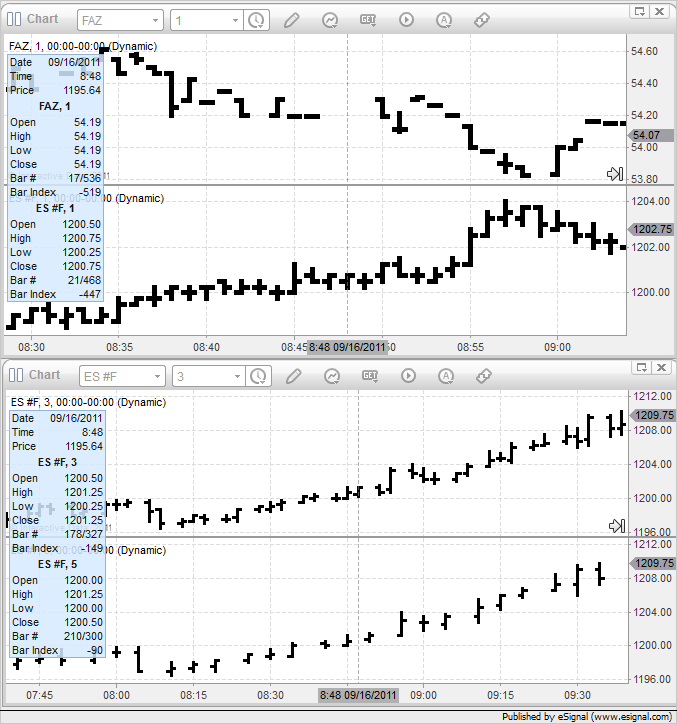
                In the image enclosed below neither chart has the Whitespaces option enabled
                Alex


                Originally posted by bobscott
                Alex,

                Good question. In actuality neither of the charts have "Whitespaces" checked so I guess the "Historical" chart is correct and indeed the "Whitespaces" are shown if the "Whitespace" is checked. The "real Time" Chart was taken from a chart which has 3 symbols inserted and it looks like that assumes that the "Whitespaces" is checked. Actually, there are a few problems with the multiple symbols chart so this may just be a "wait awhile" thing.

                Thanks,

                ~Bob

                Comment


                • #9
                  Alex,

                  All of the 3 symbols in my multiple symbols chart are set to to "1 minute" bars so that should not enter into it. I am now going to to the "Historical" chart using the multiple symbols chart.

                  Thanks,

                  ~Bob

                  Comment


                  • #10
                    Alex,

                    The image shows no Whitespace checked but obviously Whitespaces are shown.

                    Do you see anything wrong here?

                    Maybe what you are saying is "Regardless if the intervals are the same Whitespace is shown."

                    Thanks,

                    ~Bob
                    Attached Files
                    Last edited by bobscott; 09-16-2011, 08:57 PM.

                    Comment


                    • #11
                      Bob
                      That is because as I said in my previous post "Whitespaces are added [even if the option is unchecked] when you have multiple symbols and/or intervals and the bars of any one of them does not match the exact timestamp of the others else they would end up misaligned or missing"
                      FAS traded during the 8:47, 8:48 and 8:49 time frames while FAZ did not so the application inserts Whitespaces in the FAZ chart so as to maintain the proper alignement of the bars between those symbols
                      Alex


                      Originally posted by bobscott
                      Alex,

                      The image shows no Whitespace checked but obviously Whitespaces are shown.

                      Do you see anything wrong here?

                      Maybe what you are saying is "Regardless if the intervals are the same Whitespace is shown."

                      Thanks,

                      ~Bob

                      Comment


                      • #12
                        Alex,

                        I guess this is not a "biggy" but I would suggest that for Mulltiple symbol charts that the "Whitespace" check in "Properties" be "Permanently" checked just to eliminate confusion.

                        Thanks,

                        ~Bob
                        Last edited by bobscott; 09-16-2011, 09:15 PM.

                        Comment


                        • #13
                          Originally posted by Alexis C. Montenegro That is because as I said in my previous post "Whitespaces are added [even if the option is unchecked] when you have multiple symbols and/or intervals and the bars of any one of them does not match the exact timestamp of the others else they would end up misaligned or missing".....
                          Alex
                          Alex,

                          My tiny brain is easily confused. In summary, I believe you said "Whitespaces are always added when you have multiple symbols". Is that correct?

                          Thanks,

                          ~Bob

                          Comment


                          • #14
                            Bob
                            That is not what I said. I said that they are added if the bar of any one symbol or interval does not have an equivalent bar [ie with the same time stamp] in the other symbol or interval. This is necessary to maintain all the plotted bars properly aligned.
                            That said if for example you have a 1 minute chart of two symbols neither of which has traded at a given time then there will be no whitespace added for those times frames IF the Whitespace option is unchecked
                            So to be precise while these are technically whitespaces they are not added by the Whitespace option which instead fulfills another role [more on this below]
                            As an example of what I am saying see the following screenshots
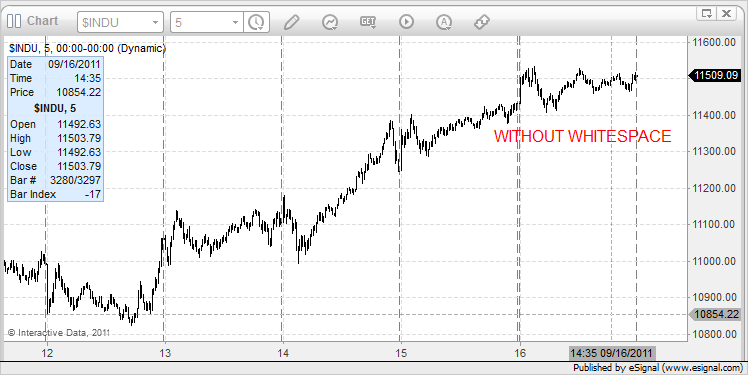
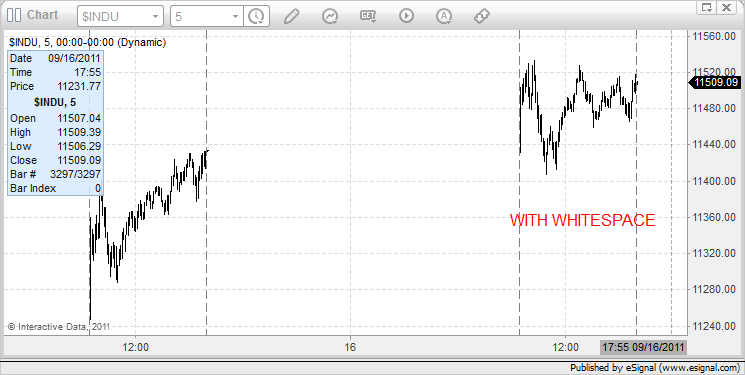
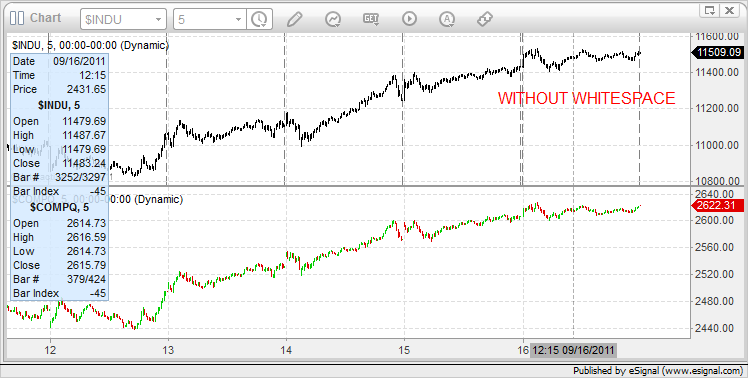
                            In this first one I have $INDU on its own without Whitespaces followed by one of the same chart with the Whitespace option enabled


                            Now I add to the chart the symbol $COMPQ which has similar trading hours. The next screenshot is without Whitespaces checked. Notice that Whitespaces are not added for all time frames where neither symbol has any data in them


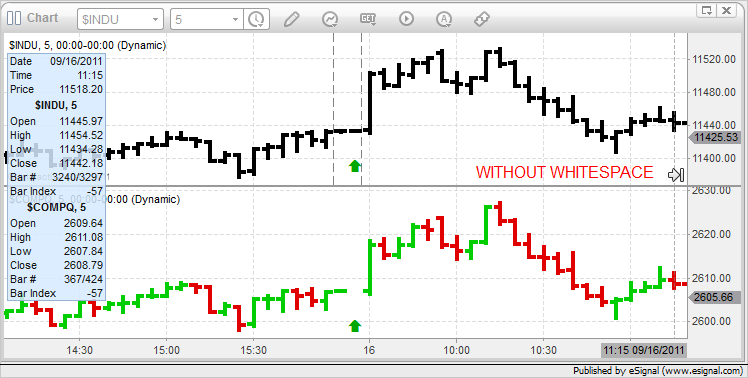
                            Here is a detail of the above chart that shows that some whitespace is added to the $COMPQ chart where $INDU had some data while $COMPQ did not [marked by the green arrow]
                            This place holder is necessary else the bars would end up out of alignment and on the same cursor you would have the bar of one symbol with one timestamp and a different timestamp for the other symbol


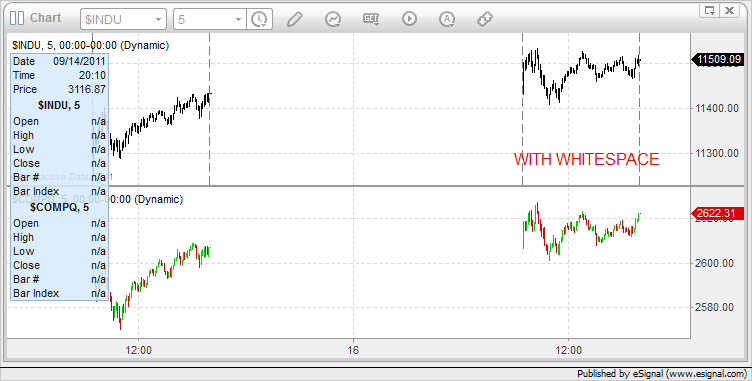
                            And here is the same chart as the first one with the Whitespaces option instead enabled. Notice that whitespaces are now added for all time frames regardless of the fact that neither symbol has any data in them.


                            The above brings me to what you said earlier ie ” …for Mulltiple symbol charts that the "Whitespace" check in "Properties" be "Permanently" checked…” which I would disagree with because if eSignal were to follow your suggestion then the flexibility I just illustrated would be lost. Furthermore I would have to see Whitespaces across the entire chart even where they are not necessary.
                            IMHO the way eSignal has implemented this feature instead allows a choice of how to view the chart while at the same time preserving the correct alignment of the bars of multiple symbols and/or intervals
                            Alex


                            Originally posted by bobscott
                            Alex,

                            My tiny brain is easily confused. In summary, I believe you said "Whitespaces are always added when you have multiple symbols". Is that correct?

                            Thanks,

                            ~Bob

                            Comment


                            • #15
                              Alex,

                              I understand and agree completely. I normally would turn Whitespace OFF but particularly while using the multiple symbol chart it is necessary to have Whitespace ON in functionality to keep the bars aligned.

                              I think I went tangential when the original problem of bars not always plotting was my focus. If you could verify this (see initial post) as well as Avery that would be nice since it is often misleading.

                              Thanks for getting my headed pointed forward again.

                              Have a great weekend!

                              ~Bob
                              Last edited by bobscott; 09-17-2011, 10:41 AM.

                              Comment

                              Working...
                              X