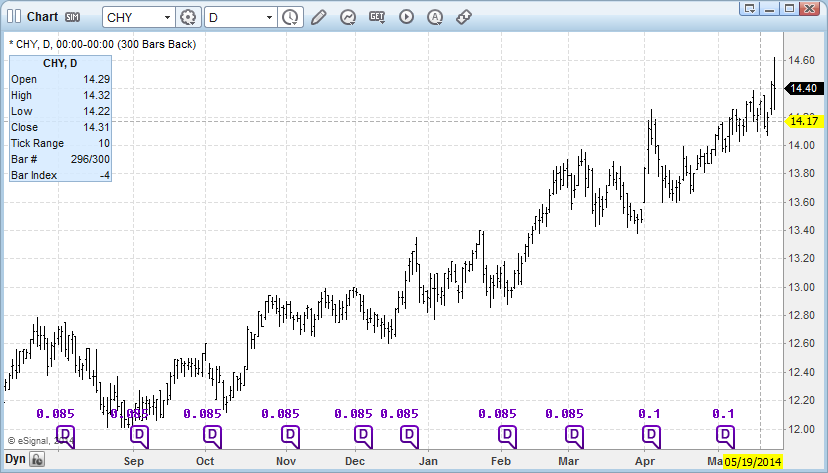
I have a daily chart which is set up to show dividends but there seems to be a lot of dividends that aren't real. For example, CHY pays dividends every month. For 2014, the amounts and ex-div dates verified by other websites are as follows:
2/7 .085
3/7 .085
4/8 .1
5/8 .1
My daily chart lists all the above, but also shows much larger dividends approximately one week prior to the above list. These larger dividends are not correct, or am I missing something.
Other stocks which pay quarterly display show monthly dividends in the range of .26-28 cents which don't make any sense. I am new to dividends so I may be missing something. Could someone explain what I am missing? Thank you.

Comment