Hi!
I hope this is the right board to address this, and I apologize if it's not...
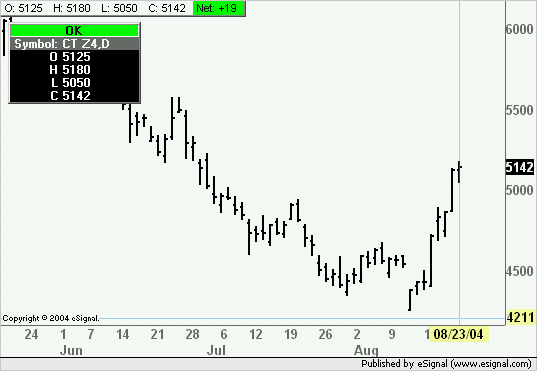
I will post only one example.. but I have noticed that on almost all of the commodities I am looking at (daily charts only).. the closing price, alongside opening prices and high and low of day prices, all are one tick below where they actually have reached.
8/23 cotton closed at 5142 , however Esig shows it at 5141.
This phenomenon happens on all commdities ,and on O, H and L as well...
Please help me get to the bottom of this issue..
Thanks,
Dana Berliner


Comment