Announcement

Collapse
No announcement yet.

Many Gaps 720 min currency not Daily or smaller Min

Collapse
X
 
  • Filter
  • Time
  • Show
Clear All
new posts

  • Many Gaps 720 min currency not Daily or smaller Min

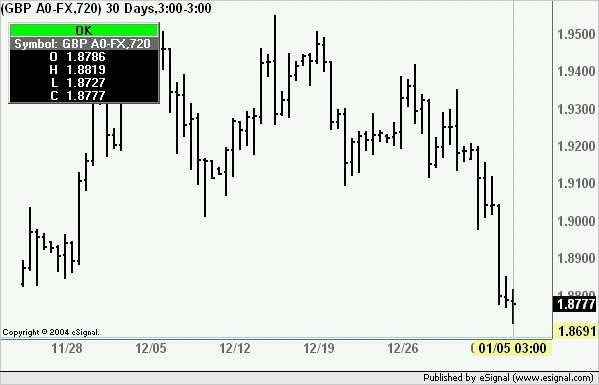
    Example for GBP A0-FX

    Can someone offer an explanation why I often see gaps between AdvChart candles on the 720 minute charts on currencies pairs where there is not such larg gap on the daily or 360 minute?

    For instance right now 23:00EST I see the latest 720 min candle labeled with time of 12:00 has high of 1.8857, prior candle labeled 01/04/05 00:00 has low of 1.9019 showing gap of 162 pips. The 360 min candles, 00:00 has same low of 1.9019, next candle at 06:00 has high of 1.8972 shows gap of 47 pips. The 60 min chart shows no gap at all between tails through this time range indicating continuos trading.

    My daily chart on stocks only reflects mkt open time even if set to 24 hour.

    It is as if the larger minute charts do not reflect part of the after-hours trading day like the daily, though that makes less sense with currencies.

    Perhaps I am just missing some fundamental piece of knowledge here on these charts?

    Thanks in advance
    Dave

  • #2
    Dave
    If the chart interval does not fit exactly in the time offset between your local time and PST then set your Time Template to Start/End at the equivalent local time of 00:00PST.
    For example if you are on EST you have a 3 hour (180 minute) offset with PST. If you want to plot a 720 minute chart (which does not fit into 180 minutes) then set the Time Template for that interval to Start/End at 03:00 (which corresponds to 00:00PST+offset)
    Once you do that you bypass the server reset that happens at 00:00PST and the resulting chart should plot correctly (see attached image)
    Alex

    Comment


    • #3
      Hi Alexis,
      Can you post and example Time Template to show how you do this. I have also experienced the gap problem on my 480min Forex charts, and I also use EST.

      Many thanks,
      Paul

      Comment


      • #4
        Paul
        If you have EST on your computer then set the Time Template as follows and I believe you should not have any problems
        Alex


        Comment


        • #5
          Alex,
          Thanks a lot, it's been important to know this as accurate data is crucial.

          I've set all of my Adv Charts to the PST 3.00 - 3.00 Time Template. I tested both Forex and E-Mini data and found that both suffered from the gapping problem when using the EST 00.00 - 00.00 Time Template; are all of eSignals servers (which supply all of the Financial data provided by eSignal) reset at 00.00 PST?, and is this also what defines the Daily Close for data?

          Thanks,
          Paul

          Comment


          • #6
            Paul

            is this also what defines the Daily Close for data?

            No the daily Close is set at 15:00PST. For more information on the Forex service you may want to read this article in the eSignal KnowledgeBase
            Alex

            Comment


            • #7
              eSignal freezes

              Alexis,
              Your time template setting did work wonderfully on 720 min gap problem. I tend to use one primary AdvChart with many time periods as favorites, clicking between them from 1, 3, 5, 15, 30, 90, 180, 350, 720, D, W, M. Problem is at the least, when I go down to 1 min and maybe 3 and 5 min chart the software goes into overdrive and eventually I get not responding. I have 3 ghz processor with 1 GB ram. Processor usage goes to 50% and above and Winsig is getting bulk of it. Finally figured out setting back the time template to 24 hour EST I don't lock up.

              Is my only choice to have a separate AdvCHart for just the 720 with time shift?

              Advice is appreciated.
              Dave

              Comment


              • #8
                Dave
                Set the Time Template to load the appropriate number of Days/Bars according to the interval of the chart.
                In the example below you can see that I have set all the intervals greater than 60 minutes to 03:00EST (equivalent to 00:00PST) for the reasons explained earlier in this thread and then I have some specific intervals defined each of which is set to load a different number of Days/Bars. If I use any interval other than those specified then the Time Template applies the Intraday Default.
                You can also create User Defined settings for Daily (D), Weekly (W) or Monthly (M) charts. In those cases you do not need to specify Start/End times as they are not used with those intervals.
                Alex

                Comment


                • #9
                  Daily versus 1440

                  Alexis,
                  If you don't mind I have a few more questions about Time Template. Per your example I now have a custom Time Template I call FOREX. Ther is an entry I-Default 600 bars 18:00 18:00.
                  I have all the various minute charts working ok. Problem is with a Day chart. The "D" does not plot without more frequent gaps and open & close prices don't always match 60 min O & C.

                  The template does not keep the start and end time setting when I save the template. The start & end times show in the AdvChart header area but when I re-edit the FOREX, D the times are empty. The bars patterns do not match the custom 1440 min entry when I set that to 3:00 3:00. I think the 1440 is the correct bar display however it has limit of 120 days. I change it in edit template and it still plots 120 days even though again the AdvChart header shows 600 days.

                  I wish two things. Have an accurate day plot with more than 120 bars. Second I wish I could shift the day start and stop around so I can quickly get O H L C for the day range of my chosing. Else I have to go to say 60 min bars and scroll through to my times.

                  I dumped 60 min OHLC for three days then did same for my "D" and 1440 in my template and tried to match the O C. The 1440 3:00 3:00 matches up to O & C but the I could not match the O C
                  from 60 min bars to the "D" data.

                  Am I stuck with accurate days and only 120 plot points using 1440 minutes 3:00 3:00?

                  Is there a good resource for this kind of operational information on eSignal'w web, the software help is just basic mechanical info, not logical use.

                  Thanks for all your help.

                  Dave in Detroit

                  Comment


                  • #10
                    Dave

                    The template does not keep the start and end time setting when I save the template. The start & end times show in the AdvChart header area but when I re-edit the FOREX, D the times are empty.

                    If you look at my prior reply you should see that I said that with Daily (D) Weekly (W) or Monthly (M) intervals you do not need to specify the Start/End times because they are not used by those intervals. That is why the next time you open the Time Template the times you have set up are not retained.

                    The "D" does not plot without more frequent gaps and open & close prices don't always match 60 min O & C.

                    Actually it does but it appears that eSignal is using 17:00 EST as the Start/End and not 18:00 EST. If you are on a 60 min chart the Open for the day will be the Open of the 17:00 EST bar and the Close for the day will be the Close of the 16:00 bar.
                    Take for example the Daily bar for 1/17/2005 where Open and Close are 1.3066 and 1.3019 respectively. You will see that in the 60 min chart the Open for that day is on the 17:00 EST bar of 1/16/2005 which in fact shows an Open of 1.3066 and the Close of that day is on the 16:00 EST bar on 1/17/2005 which in fact shows a Close of 1.3019

                    I change it in edit template and it still plots 120 days even though again the AdvChart header shows 600 days

                    That is because at this time eSignal provides up to a maximum of 120 days of intraday data. Irrespective you should be able to use the Daily bar given the information above
                    Hope this helps
                    Alex

                    Comment


                    • #11
                      Alexis,
                      Attatched word doc, had msg typed and could not paste into the forum reply box.

                      Dave
                      Attached Files

                      Comment

                      Working...
                      X