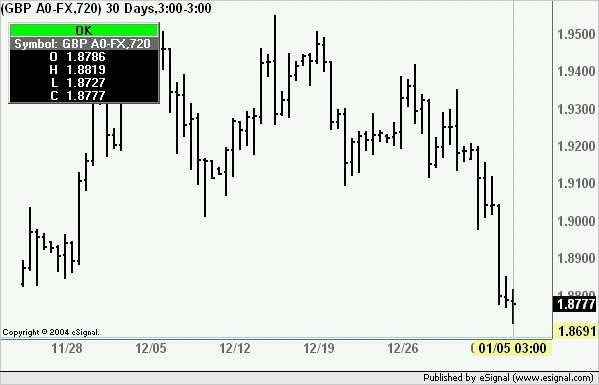
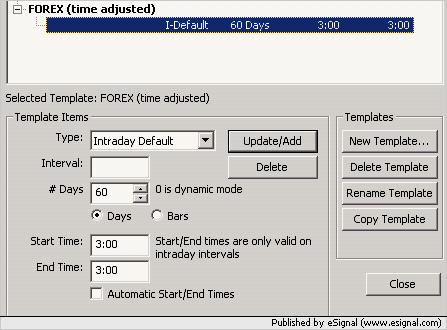
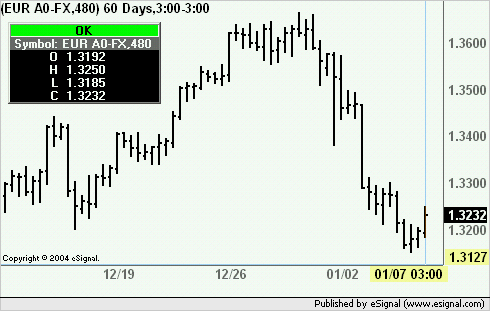
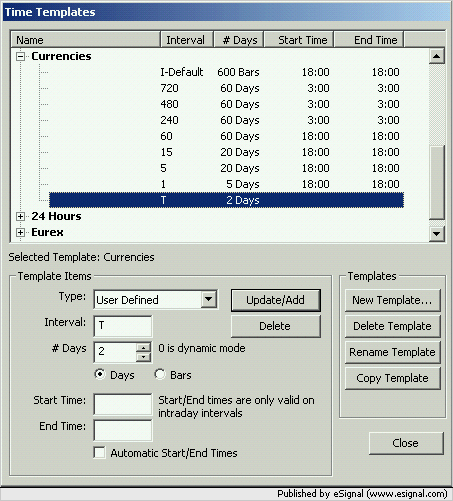
Example for GBP A0-FX
Can someone offer an explanation why I often see gaps between AdvChart candles on the 720 minute charts on currencies pairs where there is not such larg gap on the daily or 360 minute?
For instance right now 23:00EST I see the latest 720 min candle labeled with time of 12:00 has high of 1.8857, prior candle labeled 01/04/05 00:00 has low of 1.9019 showing gap of 162 pips. The 360 min candles, 00:00 has same low of 1.9019, next candle at 06:00 has high of 1.8972 shows gap of 47 pips. The 60 min chart shows no gap at all between tails through this time range indicating continuos trading.
My daily chart on stocks only reflects mkt open time even if set to 24 hour.
It is as if the larger minute charts do not reflect part of the after-hours trading day like the daily, though that makes less sense with currencies.
Perhaps I am just missing some fundamental piece of knowledge here on these charts?
Thanks in advance
Dave


Comment