Announcement

Collapse
No announcement yet.

Tick Chart Problem Version 7.8

Collapse
X
 
  • Filter
  • Time
  • Show
Clear All
new posts

  • Tick Chart Problem Version 7.8

    I watch various tick charts on several instruments. For instance on ECH5 if I have a 200Tick chart loaded with bollinger bands and stochastics, sometime overnight all the bands, stochastics get shifted forward. I've tried this on various numbers of ticks and the same thing happens. The only way to fix it is completely shutdown eSignal and datamanager and reload. This never happened in version 7.7.

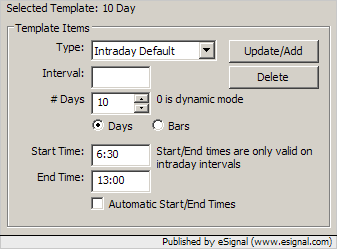
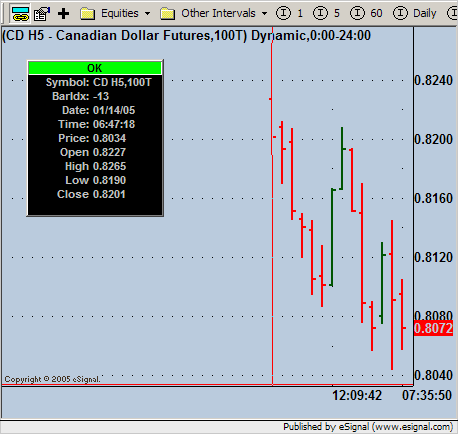
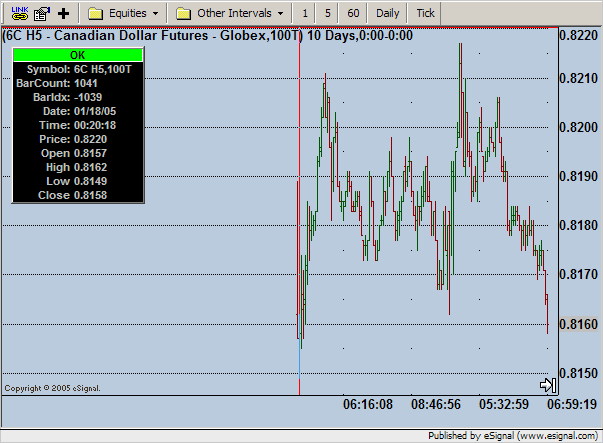
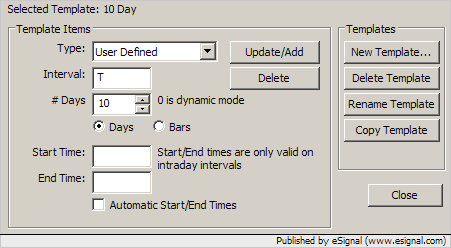
    Also, for CDH5 tick charts for some reason now its only loading data back about 5 days and sometimes not even 2 days. I've checked my timetemplats and nothing has changed there that would cause this.

    THIS IS EXTREMELY FRUSTRATING AT the LEAST! What is the problem?

  • #2
    Hello TBond,

    The first issue you're describing sounds like the Tick chart Drifting bug. This has been a known problem and work has been done to correct this in the last version and the current beta version for 7.9. This was not an easy one to fix, but we're hoping to have it completely nailed down for the 7.9 release.

    As for tick data going back to 10 days, I'm not seeing a problem here. Using a 100T interval on CD H5 is loading data going back to 1/14. I'm using a custom time template that loads 10 days of data for Intraday intervals.


    What are the time template settings you are using?


    Jason K.
    Project Manager
    eSignal - an Interactive Data company

    EFS KnowledgeBase
    JavaScript for EFS Video Series
    EFS Beginner Tutorial Series
    EFS Glossary
    Custom EFS Development Policy

    New User Orientation

    Comment


    • #3
      Jason,

      Thanks for the prompt reply.

      First, I am using version 7.8 and my charts are "drifting". This "drifting" as you call it was never a problem until I upgraded to version 7.8 from version 7.7.

      Second, for my time template, I have start and end times set to 1800 and 1700 (that is the trading period for the electronic version of currencies).

      Also, I have the #days set to ) for dynamic - I assume this means it will load the maximum available.

      Third, sorry but I am plotting 6CH5, not CDH5 as in original post. A 100T chart only plots back to 01.21.05 even using the #days of 10. I know there is data beyond 01.21.05 since I was plotting the same chart before then.

      Comment


      • #4
        Hello TBond,

        Looking at 6C H5 on 100T chart today is showing history going back 10 days to 1/18/05.


        Try modifying your time template to the settings below and see if the data comes in for you.

        Jason K.
        Project Manager
        eSignal - an Interactive Data company

        EFS KnowledgeBase
        JavaScript for EFS Video Series
        EFS Beginner Tutorial Series
        EFS Glossary
        Custom EFS Development Policy

        New User Orientation

        Comment


        • #5
          Jason,

          My data for today, 01.31.05, only goes back to 01:45AM on 01.26.05.

          I created a new time template to match the one you posted and applied that to my tickchart (I double checked to be sure it was the new one) and I still only show data to 01:45AM on 01.26.05

          Comment


          • #6
            Hello TBond,

            Please send me a PM with your eSignal user name and account number. We'll check to see if the data is missing on the server you are currently connected to.
            Jason K.
            Project Manager
            eSignal - an Interactive Data company

            EFS KnowledgeBase
            JavaScript for EFS Video Series
            EFS Beginner Tutorial Series
            EFS Glossary
            Custom EFS Development Policy

            New User Orientation

            Comment


            • #7
              Hello TBond,

              Our technical support reps checked the tick server you were connected to and verified that the tick history is present going back to 1/18. If you are certain that you have created the time template properly and applied it to your chart then you will need to call in to Tech Support so they can further troubleshoot the problem with you directly.
              Jason K.
              Project Manager
              eSignal - an Interactive Data company

              EFS KnowledgeBase
              JavaScript for EFS Video Series
              EFS Beginner Tutorial Series
              EFS Glossary
              Custom EFS Development Policy

              New User Orientation

              Comment

              Working...
              X