Announcement

Collapse
No announcement yet.

Applying a Time Template

Collapse
X
 
  • Filter
  • Time
  • Show
Clear All
new posts

  • Applying a Time Template

    I've been told by one of the esignal support staff that eSignal data goes back 60 days.

    I want to download to an .xls the ff:

    DJIA for the last 60 days at 1 minute intervals in numerical format.

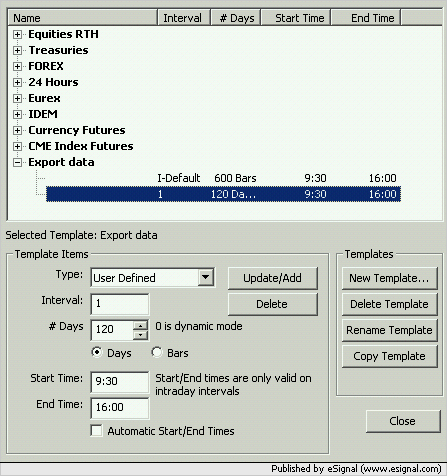
    I was informed that I had to create the requisite time template, which I did, under chart options and Time Template. The time template that I wish to use is ticked.

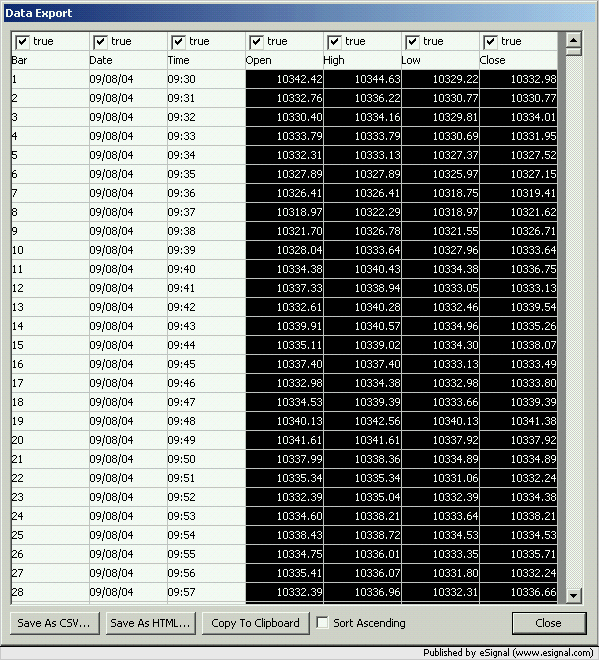
    However, when I try to export the data to a spreadsheet, it seems to default to five minute intervals and only over the last few days.

    What am I doing wrong?

  • #2
    johntherevelato
    You can download up to a maximum of 120 days of intraday data.
    Create a new Time Template called for example Export data.
    Then select User Defined, set the Interval to 1 (for 1 minute data) then set the # Days to 120. Also set the Start/End Times if required and lastly click the Update/Add button (see image). Then click Close.
    At that point right click the chart, select Time Templates->Export data. set the interval of the chart to 1 minute and the chart should begin downloading the data. Once the process is complete right click the chart, select Tools->Data Export select the columns you wish to export and click Save as CSV
    Alex

    Comment


    • #3
      I've followed your instructions. However, when I actually try to export the data, it gives data at 1 minute intervals but only going back to 15th February.

      For some reason, it doesn't seem to want to activate the 120 day time template. And, yes, the relevant template is ticked and yes, I have clicked on the graph, and then right clicked to execute the data export instruction.

      It might be a problem with downloading the data from the esignal site. Obviously, it's a lot of data.

      Comment


      • #4
        I've now applied your instructions to the 60 day template and it seems to have worked. The reason it didn't work before was because I hadn't clicked on the chart in the correct way.

        I spoke to an eSignal representative and they told me that the data only goes back 60 days, and so it seems that they are correct.

        Could it be something to do with the version I am using? I am using version 7.8.

        Anyway, it would still be useful to get the 120 day data capture.

        Thanks.

        Comment


        • #5
          johntherevelato
          FWIW I just requested 120 days and in the image enclosed below you can see where the 1 minute Data Export is starting from.
          Alex

          Comment


          • #6
            I find that I have to input the 1 minute, 24 hour time template to view the graph, and then if I scroll the graph back manually to the relevant date, then I am able to export the data in the requisite manner.

            So, obviously, with what you have shown below, I would have to manually scroll back to August 2004.

            The problem with this is that it takes a few minutes to scroll back to the relevant date. Is there a quicker way?

            Comment


            • #7
              johntherevelato
              If you have to scroll back to bring up the data in the chart then that very likely means that your Time Template is set to Dynamic (ie the # Days field is set to 0) and not as I showed you in a prior image. FYI I did not have to scroll back at all to bring up the data for export.
              Alex

              Comment


              • #8
                Hi, I've finally managed to sort it out. The problem was to do with the way I had entered the information into the conditions for the time template.

                Got there in the end. Thanks for your help.

                Comment

                Working...
                X