Announcement

Collapse
No announcement yet.

Trendline Problem

Collapse
X
 
  • Filter
  • Time
  • Show
Clear All
new posts

  • #16
    dhunniford
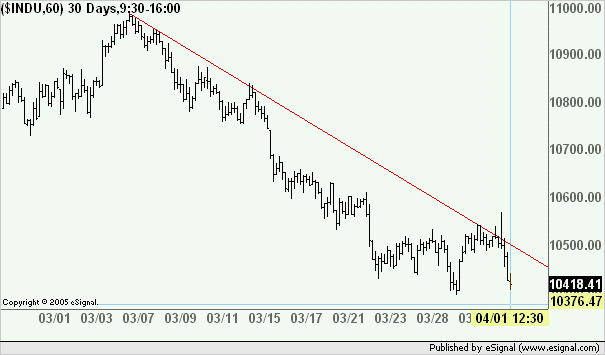
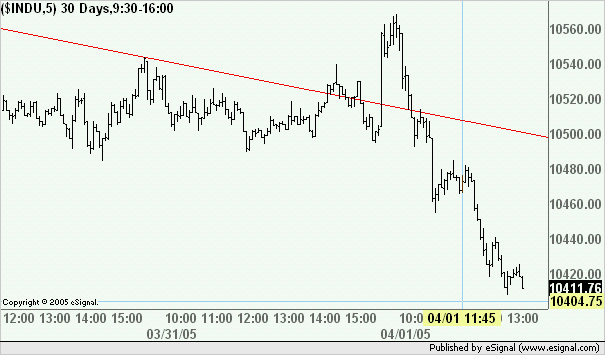
    As I said try the Time Template I suggested. Also you may want to post an image of your Time Template that loads the 60 Days
    Alex

    Comment


    • #17
      Sure, one time template
      Attached Files
      Hope for the best.....Plan for the worst!

      Comment


      • #18
        Ok changing to the time template did not help, as I expected, but certainly worth a try. I have another theory which I will try out this weekend and will post back if it solves the problem.

        On a seperate note I have a question regarding templates. Why would I want to set the number of days information to say 30, or 60 days, as opposed to just leaving it dynamic? What would I gain by doing this? I have, as I said before run my charts at 60 days, but in all honesty I don't really know why, just seemed like a good idea at the time. But I would be interested in knowing if there was an advantage to it.

        Thanx
        Hope for the best.....Plan for the worst!

        Comment


        • #19
          dhunniford
          When an Interval in a Time Template is set to Dynamic the chart requests only the data required to fill the chart for that interval. If you then scroll back the chart requests more data again only enough to fill the chart and so on (this happens with all intervals except tick based).
          If you use long term studies or drawing tools it should be an advantage to set the chart to load enough days back so that these studies and drawing tools will have the data required to compute and/or draw correctly. Note that you don't need to have the same #Days/Bars for all Intervals ie you can assign different settings to individual Intervals (which is how I have mine set up)
          Anyhow in your case it appears that the chart is not loading enough data on the lower intervals. Scrolling back requests the necessary data and the trend lines then draw correctly.
          FWIW I just tried to repeat the process with another symbol and as far as I can see the result is that the trend line is drawing correctly without the need to scroll back
          Alex


          Comment


          • #20
            Ok thanx for the info, I appreciate it, the fact that you cannot recreate my experience, coupled with the fact that I would have noticed this problem before leads me to conclude it has come about as a result of the time change ie our clocks going forward last weekend and US not until this weekend, before the problem my charts ran a 60 day template with a time template for 14:30 - 21:00 UK time, when our clocks moved I altered the time to 15:30 - 22:00 to compensate,. It was after this that I noticed the problem for the first time and switched to dynamic and removed the time constraint. I don't know exactly how this would have caused the problem exactly, but I have become convinced that this is the source This weekend I intend to redo all my charts as US clocks will have caught up and see if that solves the problem. I will post back the result.

            Thanx again for your help.
            Hope for the best.....Plan for the worst!

            Comment


            • #21
              Ok just to update. I have replaced my charts and redone all the settings. US time has now returned to 5 hrs difference NY - London and everything is fine as it was before, all trendlines etc where they belong. I have no idea exactly what caused the problem but it would appear to be related somehow to the time change and the way in which I compensated for it. Anyway all is now well again.
              Hope for the best.....Plan for the worst!

              Comment

              Working...
              X