Hello
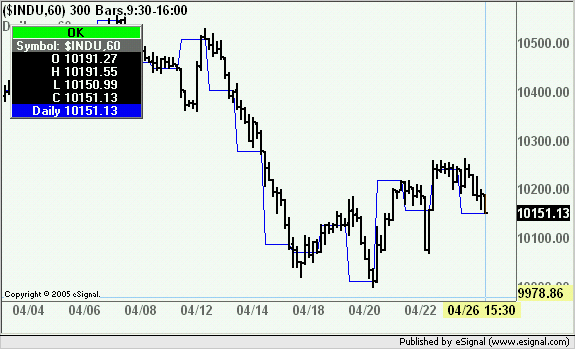
I checked the ratio and spread knowledge base but I can not seem to figure out if you can do this. What I would like to do is to view a daily chart and within this same chart a 60 minute line chart rather than having two windows open. e.g. one for daily and one for 60 minute. Example I want to view say an ibm advanced Daily chart and then have within this same chart view the action of the 60 minute?
Is it possible to do this using ratios and/or spreads as I can not figure this one out? I have tried dividing, subtracting, multiplying the symbol but can't find what matches the 60 minute.
any insights would be greatly appreciated.
Pogman

Comment