Announcement

Collapse
No announcement yet.

Spread Charting

Collapse
X
 
  • Filter
  • Time
  • Show
Clear All
new posts

  • Spread Charting

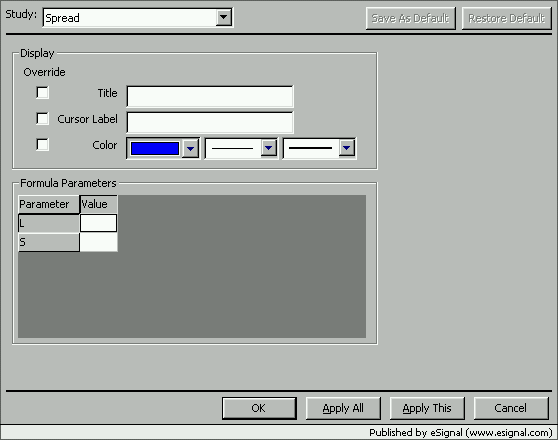
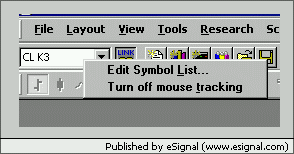
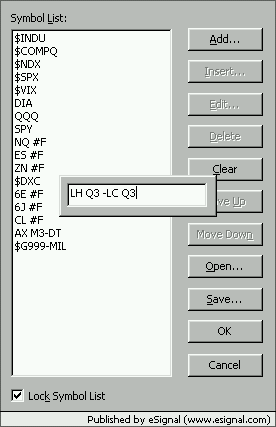
    I am a new esignal user and a spread trader. I cant seem to figure out how to open a spread chart. If I have the futures layout open and I enter the spread I want in the futures.quo area like LH Q3 - LC Q3 spread.... Aug Live hogs - Aug Live Cattle,
    it always says invalid symbol... :-( For sure I'm an esignal newbie and am used to using tradestation. Is there any way I can create a portfolio of 10-15 commodity spreads and then apply a ROC or MOM indicator with its own MA of the ROC or MOM to the spread?? Any help??....Thanks

  • #2
    var spread;
    function preMain(){
    setPriceStudy(false)
    }
    function main() {
    spread = close(0, 1, "LH Q3")-close(0, 1, "LC Q3");
    return spread;
    }

    should plot the spread in the lower pane - which can be made larger - at the expense of the main price pane.

    The second half of the request can be done but I forget how just now.

    Comment


    • #3
      ??

      Ok....were do I enter that formula? <sigh> Sorry but remember im a noob at esignal...

      Comment


      • #4
        doh!

        Ok, let's try this...

        from the main menu Tools, Editor...

        then copy the following

        var spread;
        function preMain(){
        setPriceStudy(false)
        }
        function main() {
        spread = close(0, 1, "LH Q3")-close(0, 1, "LC Q3");
        return spread;
        }

        into the editor window, then click the Save Formula As button, 4th from left

        Save the formula into the Formula directory with the name SPREAD.

        Now right clcik on the Advanced Chart window, left click on Formulas on the drop down box - near the bottom

        select SPREAD - should be near the bottom again

        The spread should show up on the chart in a separate pane at thebottom of the chart.

        Place the cursor on the line sepaating the top chart from the bottom chart and hold down the left mouse button to adjust the size of the two panes.

        Comment


        • #5
          yay

          GREAT.... heh, appreciate the info. Oh and btw, as written, that formula would be just for the aug lc/lh spread right? And then I would do the same for any other spread I wanted..?? You must be a patient guy... :-)

          Comment


          • #6
            With our current quote window, you can't enter a spread symbol or any other type of custom symbol. Our quote window will be re-designed later this year and we will be adding a great deal more functionality than currently exists.

            In addition to dloomis's suggestions, you can simply enter a spread as a symbol in Advanced Charts. Here's an FAQ on how you can set that up.

            Hope that helps.

            Thanks.

            Comment


            • #7
              grapple

              If I have the futures layout open and I enter the spread I want in the futures.quo area like LH Q3 - LC Q3 spread....

              As far as I know spreads cannot be used in Quote or Portfolio windows.

              I cant seem to figure out how to open a spread chart

              Create a new Advanced Chart (File->New->Advanced Chart).
              Once the chart is open and is selected begin typing the symbols of the spread.
              As soon as you do that a Symbol dialog box appears.
              The format for spreads (or ratios) is the following

              [symbolA][space][operator][symbolB]
              example
              LH Q3 -LC Q3
              Note the space before the operator (minus sign) and not after.

              When you are done click OK or press Enter

              Alex
              Last edited by ACM; 03-31-2003, 08:18 PM.

              Comment


              • #8
                grapple

                Oh and btw, as written, that formula would be just for the aug lc/lh spread right? And then I would do the same for any other spread I wanted..??

                Yes you would write the other spreads in the same way or use the following formula

                PHP Code:
                function preMain() {
                    
                setCursorLabelName("Spread");
                    
                setStudyTitle("Spread")
                    }

                function 
                main(LS) {
                    var 
                Long "SPY";
                    if (
                == nullLong;
                    var 
                Short "QQQ";
                    if (
                == nullShort;
                var 
                vSymbol1 getValue("Close"0, -1L);
                var 
                vSymbol2 getValue("Close"0, -1S);
                    var 
                vSpread vSymbol1 vSymbol2;

                return 
                vSpread;

                The advantage of this formula is that you do not need to rewrite and save the formula every time you want to change the symbols.
                All you need to do is right click on the indicator pane select Edit Studies from the context menu, then type in the L box the "long symbol" and in the S box the "short symbol".


                As is the formula uses SPY as the default long and QQQ as default short.

                Alex

                Comment


                • #9
                  If you prefer to chart the spreads rather than using the formulae either David or I have provided you may find that having to retype the symbols can be time consuming.
                  In that case right click the symbol dropdown list in the main Toolbar (see following image) and select Edit Symbol List


                  In the dialog box that opens then click the Add... button and in the little window type the spread (see following image)


                  Press Enter and repeat for every spread you care to have readily available.
                  Once you are done adding spreads Save this list with a name of your choice and click OK.

                  The next time you have an Advanced Chart open all you need to do is select one of these spreads from the dropdown list.

                  Alex
                  Last edited by ACM; 03-31-2003, 08:59 PM.

                  Comment


                  • #10
                    GREAT!

                    I'm squared away now...Thanks so much for all the helpful advice....!!!! :-) Oh and btw what would be the best way to learn how I can write a formula for a moving average on a ROC or MOM indicator? Thanks again

                    Comment


                    • #11
                      Here is a link to eSignal's Advance Charting Resource Center.

                      In the EFS Studies section you will find two guides on how to develop indicators and strategies while in the Formula Reference section you should find all the documentation eSignal currently has for EFS scripting plus a couple links to some JavaScript tutorials and to a document illustrating the Formula Wizard.
                      Alex

                      Comment

                      Working...
                      X