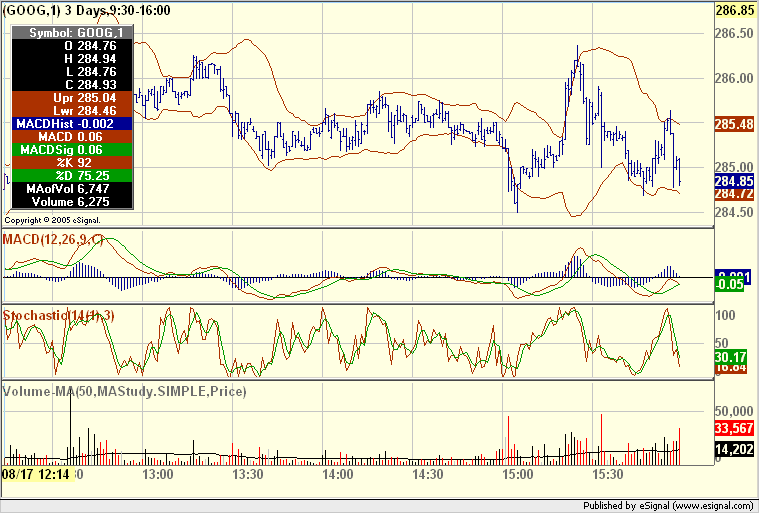
The Level II service provider that I am with, has a very powerful function called volume+ graph.
Say for instance, at 10:30 pm EST, there is a short of 18K shares, and at the last second of that minute, the stock price was a close down price, then that volume bar will be color code in RED.
Or say at 12:36 pm EST, there is a huge buy up of 70K shares, and at the last second of that minute, it indicates the stock price is higher than the previous minute close price, then the volume bar will be color code in Black.
So during any day, if you add the RED volume, you'll know the approx. Short vol, or sell vol., and if you add the Black Vol., you'll know the approx. buy up volume.
Of course, not every shares within any of those minutes is a sell or a buy, but it gives you a very good indication as to the volume is a short or a buy.
Due to file max. size, I have to cut the file to half, cut off at 1 pm, but the red and black color code is clear at the bottom.


Comment