Announcement

Collapse
No announcement yet.

Does Esignal offers a powerful function called Volume+ graph?

Collapse
X
 
  • Filter
  • Time
  • Show
Clear All
new posts

  • Does Esignal offers a powerful function called Volume+ graph?

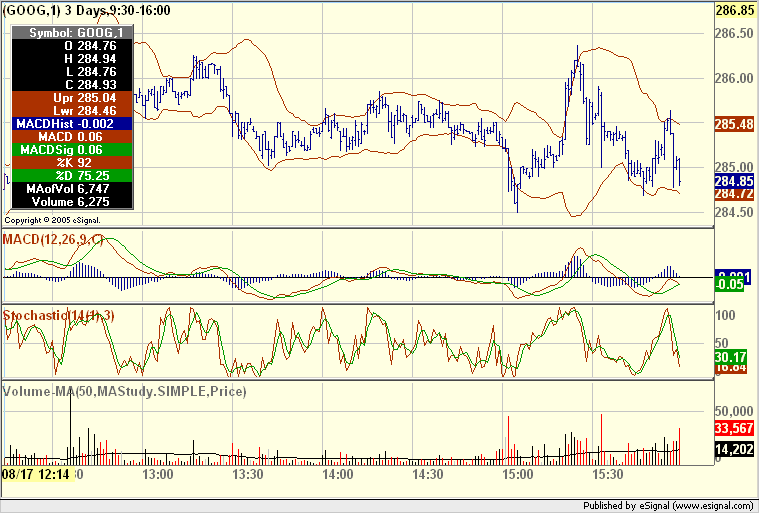
    The Level II service provider that I am with, has a very powerful function called volume+ graph.

    Say for instance, at 10:30 pm EST, there is a short of 18K shares, and at the last second of that minute, the stock price was a close down price, then that volume bar will be color code in RED.

    Or say at 12:36 pm EST, there is a huge buy up of 70K shares, and at the last second of that minute, it indicates the stock price is higher than the previous minute close price, then the volume bar will be color code in Black.

    So during any day, if you add the RED volume, you'll know the approx. Short vol, or sell vol., and if you add the Black Vol., you'll know the approx. buy up volume.

    Of course, not every shares within any of those minutes is a sell or a buy, but it gives you a very good indication as to the volume is a short or a buy.


    Due to file max. size, I have to cut the file to half, cut off at 1 pm, but the red and black color code is clear at the bottom.
    Attached Files

  • #2
    Happy Hopping
    That is easily done with an efs such as the one attached to this thread
    Alex

    Comment


    • #3
      Happy,

      You might want to take a look at the OBV indicator. On Balance Volume creates a running total of volume, adding it to the total if the corresponding price bar closed higher than the close of the previous bar, and subtracting it from the running total if the bar closed down relative to the previous bar's close.

      A moving average of volume does not distinguish between up volume and down volume like OBV does.

      Comment


      • #4
        Very useful info. Thanks guys for the reply.

        Comment


        • #5
          Happy Hopping
          FWIW you can set up an Advanced Chart to look exactly like the one you posted (see image)
          Alex

          Comment


          • #6
            Hey Alexis, thanks a lot. I'm new to esignal.

            On a minor point, I don't think there is any way to spell out the word Open, High Low, Close instead of just O H L C on the chart, is there?

            Comment


            • #7
              Happy Hopping
              Yes that can be done. Right click the Cursor Window, select Properties and remove the check mark from Short Labels
              Alex

              Comment


              • #8
                Thanks Alexis. It's just easier that way, I can save a second and don't have to think which letter correspond to which meaning. You know the way the stock market works, sometimes even 2 seconds here may as well be an internity, aka, 2 seconds can save thousands of dollars.

                By the way, I am impressed that you even match the graph background color to my one.

                Comment


                • #9
                  Happy Hopping
                  You are most welcome.
                  Alex

                  Comment


                  • #10
                    I have a supplemental question on this function:

                    Did anyone write a EPS software subroutine or something to that effect that can add the Black Volume Up, and the Red Volume Down in total, and be able to display in as part of the screen?

                    It would be immensely useful. Currently, I have to move the vertical cursor bar to each minute, add up the black volume Up via a calculator, and count them all up. I then do the same thing for the red Volume down.

                    But surely there got to be an easier way?

                    Comment

                    Working...
                    X