I have a few quick questions on Esignal that I just want to clarify:
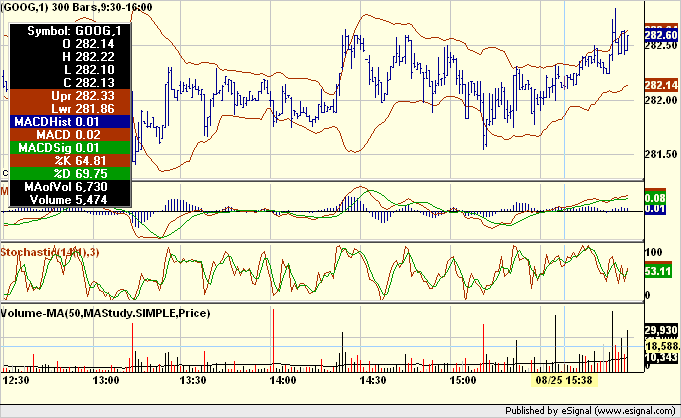
1) The current Level II provider that I'm with, display very small numbers on the graph because of Sun Java. So what I did is, I un-installed my Sun Java and installed the old Microsoft Java. Now the number on the graphs are regular size that I can read.
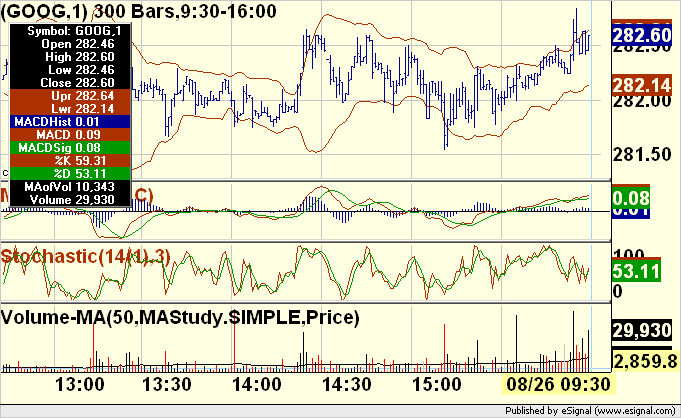
(see the size of the number on the graph from the link, note the no. on the far right of the graph, it is readable:
Does Esignal support Microsoft Java? If not, say Esignal only works w/ Sun Java, is the size of the fonts big enough for people to read say, on a 1280x1024 screen? I notice the graph that Alexis show me from this thread (below), that the font is big enough for anyone to read, but does that require a certain ver. of Sun Java?
2) My current level ii data provider, gather the stock market data from yet another provider, then pack them altogether and send them per second to my computer, so there are times that there is Time-out packets. As such, there are packet error due to the way that current provider is doing things.
There is virtually no packet loss on my side. I spoke to my ISP and provided me w/ proof. But on some days, due to the way that level ii data provider is doing things, the data would just stop feeding.
How does Esignal gather its data and feed it to each user? with my current provider, there is a huge amt. of Upload in the range of 80 MB per day (whereas my download is only 16 MB).
3) Does esignal gives streaming quote on Pre-Market and After-Market?
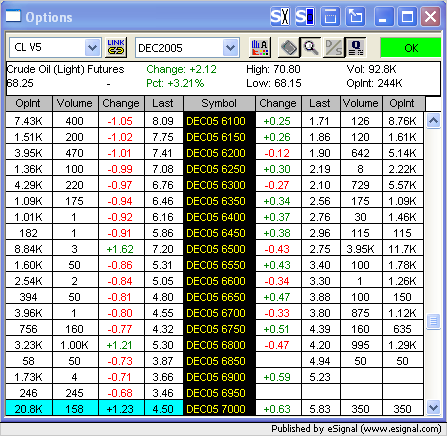
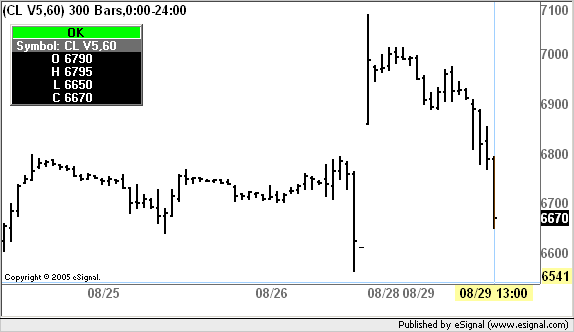
4) I was told that Esignal gives Real time Option contract on oil, in which package does it comes with? It would be nice to see real time Oil prices, but someone told me that it doesn't have that feature.
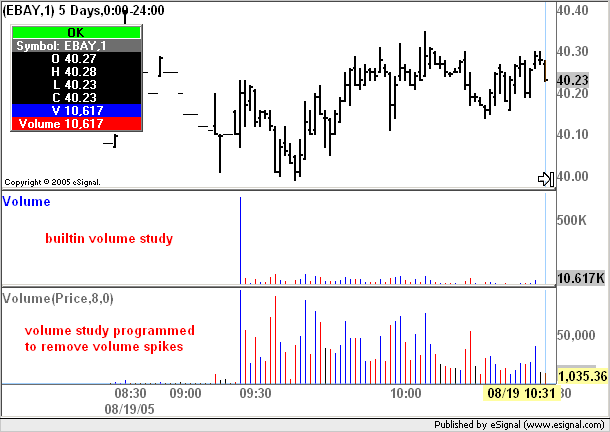
5) In far more than 1 occasion, we have seen a huge short or long vol. at a certain time of the day, say 9:30 am, we have 2 Million shares on ebay.
Then the rest of the day, the vol. per minute is only 20K to 90K. Because the bar at 9:30 am is so high, all the other volume bar becomes very tiny.
Now, one way to fix this is to kill all your indicators, and maybe you can read the vol. better, or move your pointer to that minute and read the numerical vol. of that minute. But sometimes, because the initial bar of 2 M shares is so high, even by killing all your indicators, you still can't read the difference in height on each min. vol. graph.
Does Esignal has a feature to manually adjust or kill a certain minute vol., for e.g., the 9:30 am vol. that I mention above, so you can view the volume for the rest of the day?

Comment