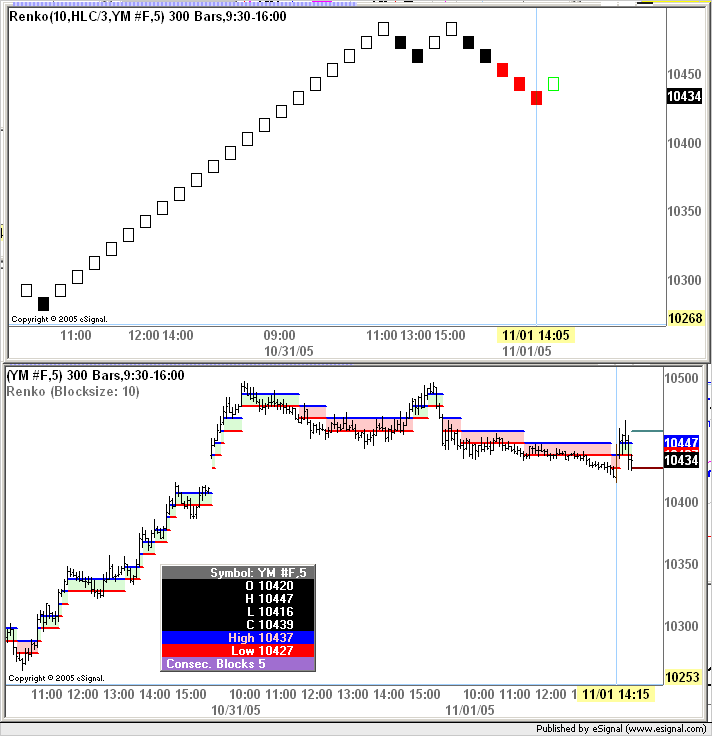
The building of a standard Renko Chart using Close values is pretty straightforward and my attempt at manually building them lines up with the Esignal charts.
However, no matter how I do the math, I cannot corrrelate my computations with the way esgianl creates a renko chart for HLC/3. For example, when I compute that two boxes need to be created, esignal prints out 3-4 boxes.
Could you please give me a quick rundown on the logic that is used in for creating the HLC/3 Renko chart?
Thanks.
Vic


Comment