Announcement

Collapse
No announcement yet.

Building HLC/3 Renko Chart

Collapse
X
 
  • Filter
  • Time
  • Show
Clear All
new posts

  • Building HLC/3 Renko Chart

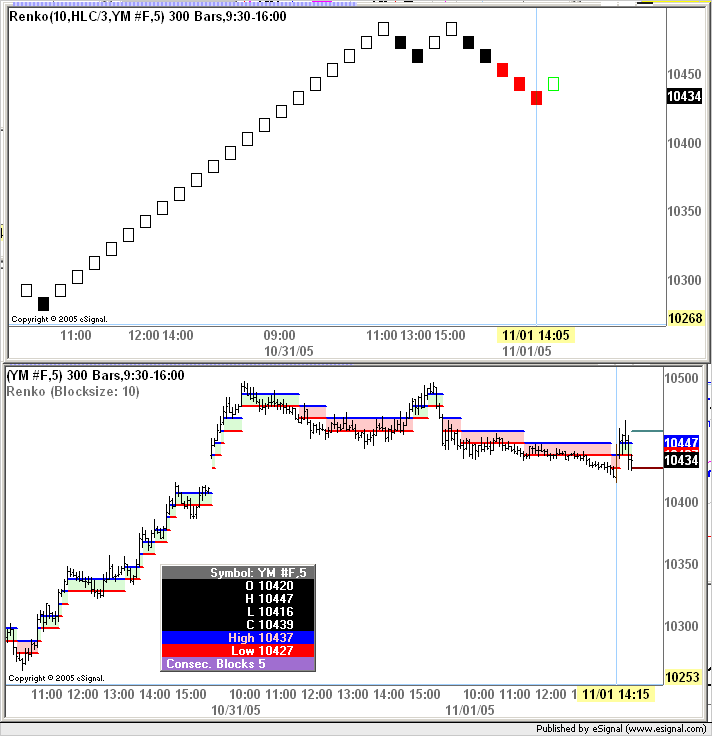
    The building of a standard Renko Chart using Close values is pretty straightforward and my attempt at manually building them lines up with the Esignal charts.

    However, no matter how I do the math, I cannot corrrelate my computations with the way esgianl creates a renko chart for HLC/3. For example, when I compute that two boxes need to be created, esignal prints out 3-4 boxes.

    Could you please give me a quick rundown on the logic that is used in for creating the HLC/3 Renko chart?

    Thanks.
    Vic

  • #2
    lunk,

    Here is a link to a Renko efs written by Chris Kryza that may be of some help

    Comment


    • #3
      Thanks Steve,

      but that efs looks like it's based on Close and has no logic for HLC/3.

      The reason I'm asking this is because I believe that Esignal's code may be wrong, and I'd like to know what criteria/logic they use in creating the renko before I make any posts about a 'bug' in the code.

      Comment


      • #4
        I've marked up some charts to show what I'm talking about, but I haven't been given the ability to post attachments. Esignal Moderator: can you please give me access?

        You can see the two charts here:

        First chart is the Candle Chart:

        http://www.ttrader.com/mycharts/disp...0Blank&id=1586

        Press "NEXT" to see the Renko chart.

        These charts are from 10-31-05
        Last edited by lunk; 11-01-2005, 10:36 AM.

        Comment


        • #5
          Vic
          Here is how you can modify Chris Kryza's Renko script to use HLC/3. In line 120 replace
          nLowLevel = rnd( close(nIndex), nPrec );
          with
          nLowLevel = rnd( sma(1,hlc3(),nIndex), nPrec );
          and in line 136 replace
          nCheck = rnd( close(-1), nPrec );
          with
          nCheck = rnd( sma(1,hlc3(),-1), nPrec );
          Then run the script on a bar chart that uses the same Time Template used on the Renko chart (ie same #Days/Bars loaded and if intraday same Start/End times).
          Once you have done that you should find that the blocks calculated by the script match those in the Renko chart.
          Alex

          Comment

          Working...
          X