I have come across a slight problem when looking at the daily charts of the e-mini's. When comparing esignal to tradestation, you get 2 very different pictures.
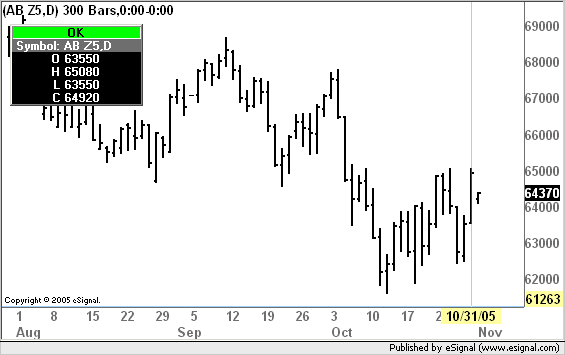
The following is from esignal on 10/31/05
Open: 642.20
Close: 643.10
High: 650.80
Low: 635.50
The following is from Tradestation on 10/31/05:
Open: 635.50
Close: 649.20
High: 650.80
Low: 635.50
As you can see the open and the close is where the problems are. When using candlesticks you get 2 different candles, which can mean two different things. The only thing I can think of is a setting with the open and close ( since it doesnt "technically"close since the globex session). But nonetheless, Im just curious to see if anyone has an idea of why i get such two different candles, when its the same information. Any input would be appreciated.
Thanks,
Nick

Comment