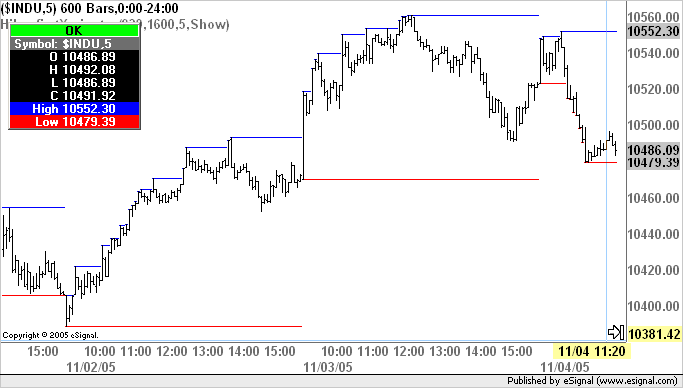
If you look at the attached image, and notice the dashed yellow line on the highest high and the dashed red line on the lowest low.
Those continue on to highlight and refresh throughout the window.
I don't even know how to enable those in TM, as I haven't attempted it, but I was looking on tmdownloads.com and was looking at the videos and saw this.
I was just curious if there is a feature in eSignal to do this as it looks like a good way to locate possible areas of support and resistance.
Thanks
EDIT: I'll be sure to look for more information on what this is and ask TradeMaven staff as to what it is, maybe someone could program it, or maybe I could take a crack at it if it is not in.


Comment