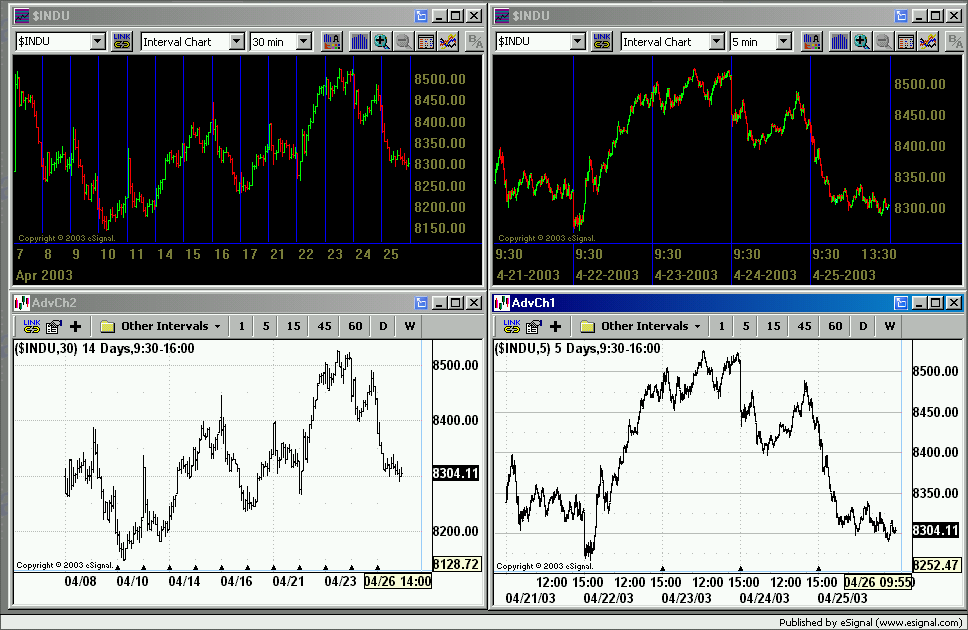
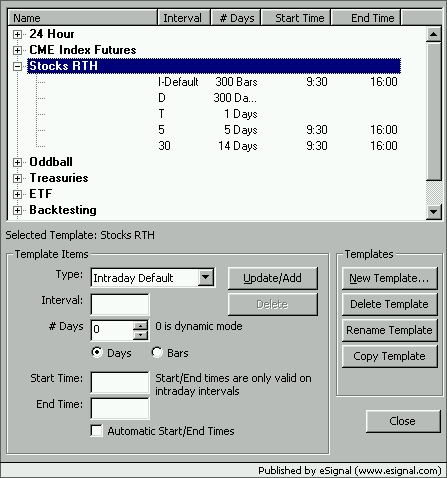
I've just started using the advanced charts but i've got a question. I keep two old school esignal charts on my screen of 5 days and 14 days. these are interval charts of a durations of 5 and 30 minutes. is there a way to replicate this on advanced charts. i'm sure it's obvious but i can send to display a set # of days without spreading the chart out the width of the screen.
Announcement
Collapse
No announcement yet.
Advanced charts time frame
Collapse
X
-
-
one more thing, is there anyway you can just email the advance chart files, it would save me a lot of problems, my address is
[email protected]
Comment
-
jeddins
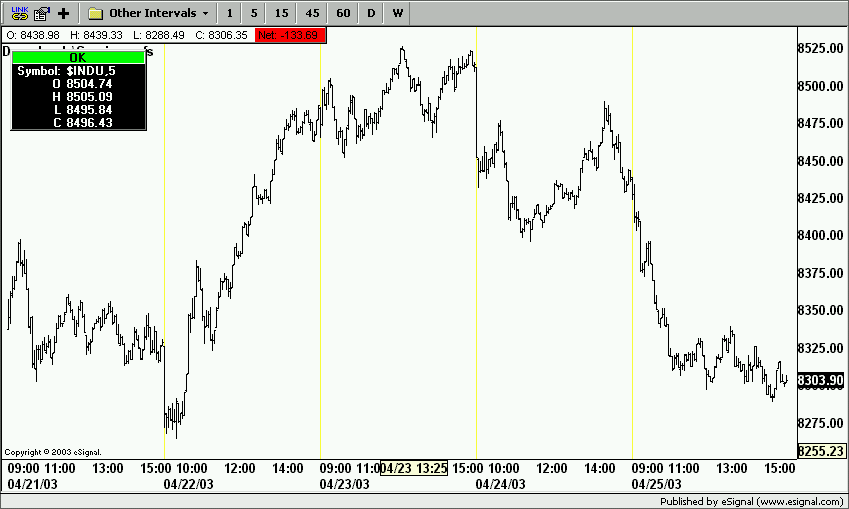
As a thank you for your kind words and to "ease" your transition to Advanced Charts <VBG> here is an efs that will plot vertical lines at the start of a new day.

This formula is not mine to begin with - all I did was add the vertical lines - and I have no idea who to thank. Anyhow it is one of those many little gems that sometimes go lost amongst the messages on this board and that are worth reviving.
Alex
PS. If you want to change the color of the line open the efs with the Editor and change the color in Line 28Attached Files
Comment
-
hey, that sessions efs is terrific.Originally posted by Alexis C. Montenegro
jeddins
This formula is not mine to begin with - all I did was add the vertical lines - and I have no idea who to thank. Anyhow it is one of those many little gems that sometimes go lost amongst the messages on this board and that are worth reviving.
Alex
thanks a lot alex
Comment


Comment