 Tweet
Tweet
Rambling comment:
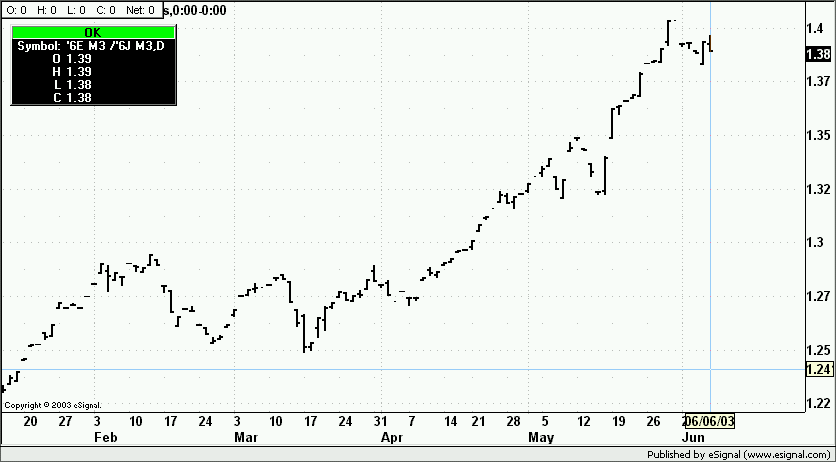
You can't use any symbol beginning with
a # as a divisor, ie 6EM3 (globex Eur/usd)
0 is always required when multipliying by
a # <1, ie 0.5
Seemingly no ( ) available
Inability to create custom symbol for
display in quote table. This would be
a very useful feature!
You can't use any symbol beginning with
a # as a divisor, ie 6EM3 (globex Eur/usd)
0 is always required when multipliying by
a # <1, ie 0.5
Seemingly no ( ) available
Inability to create custom symbol for
display in quote table. This would be
a very useful feature!
Comment