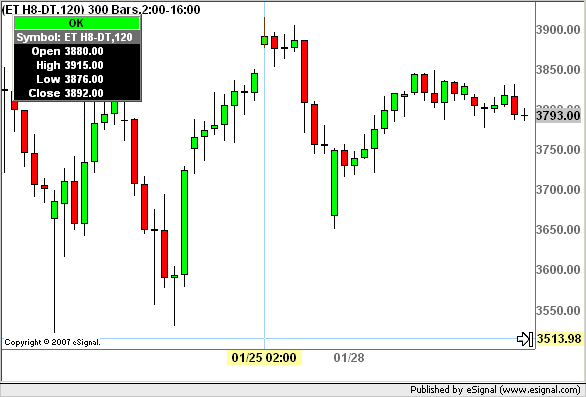
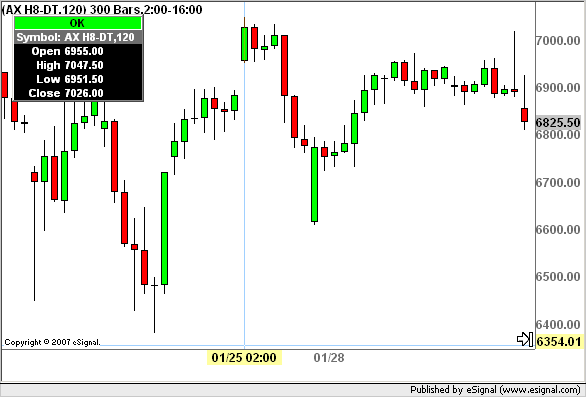
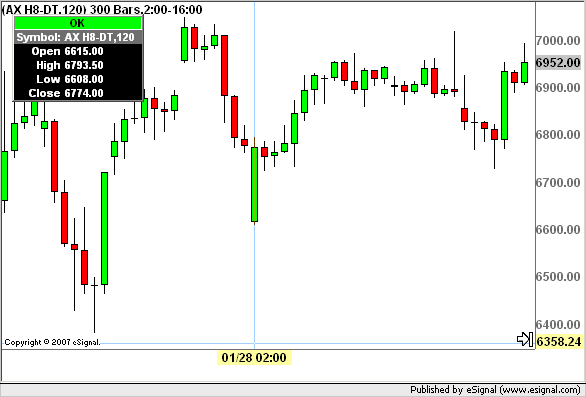
Found out that esignal displays candlestick bars not according to the underlying data.
If you take look at the screenshot on 1/25 ET H8-DT opened with a gap and closed at 3909. (the green bar that closes outside the BB). However the next red bar opens way lower as if there was a intraday gap which is very unlikely.
First i thought this was a data issue but when i looked at smaller timeframes like 60 or 30 minutes everything is displayed correctly. Also if i use a 3rd party app using the same esignal feed its displayed the way it should be.
And yes i am using the latest esignal build .
neo


Comment