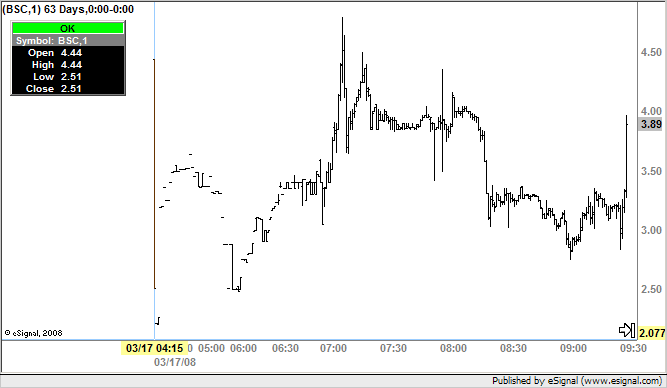
I want a 1 minute chart for BSC from 3/17/8. How would I accomplish this?
Announcement
Collapse
No announcement yet.
Minute By Minute Chart of Stock From Past
Collapse
X
-
Re: Minute By Minute Chart of Stock From Past
theking2000
In the Time Template add a User Defined entry and set the Interval to 1 and the #Days to 63. That will load the chart back to March 17th (see enclosed screenshot)
For detailed instructions on how to set up and use Time Templates see this article in the eSignal KnowledgeBase
Alex

Originally posted by theking2000
I want a 1 minute chart for BSC from 3/17/8. How would I accomplish this?
-
Thanks for the quick response. I attempted to do it - but it is not working. I went into "edit" of time templates. Is there supposed to be a tab which actually says "user defined" because it's not on my screen. I simply went to the bottom to "template items," # days 63 Interval 1...but it won't change the screen.
Comment
-
We have a "go to date" in Time and Sales but that only goes back 10 days in that window type. Are you scrolling back on tick data, 5 min, 30 min, daily or something else? Have you tried dragging the bottom scale (mouse over the time/date axis and left-click and slide right). That at least compresses the data.
That "go to date" function would be nice in a chart. I'll forward that along.
Thanks.
Comment
-
Two heads are always better than one....
A little bird has pointed out that we do in fact already have a "go to" date under the right click for "tools". You'll need to first set the time template to 120 days and then you can jump back to any day in the last 6 mos.
You can also scroll faster by pressing Ctrl+Left/Right Arrow.
Gotta love our users. Thanks Alex!
Comment
Comment