Announcement

Collapse
No announcement yet.

Chart with 2 dataseries?

Collapse
X
 
  • Filter
  • Time
  • Show
Clear All
new posts

  • Chart with 2 dataseries?

    Hello,

    is it possible to add a 2nd dataseries to a chart? For example, i want to plot Nat Gas and Crude Oil in the same chart, with the NG price axxis plotted on the right side, and the CL price axxis plotted on the left side.

    Regards,
    P.
  • #2
    Re: Chart with 2 dataseries?

    pippi
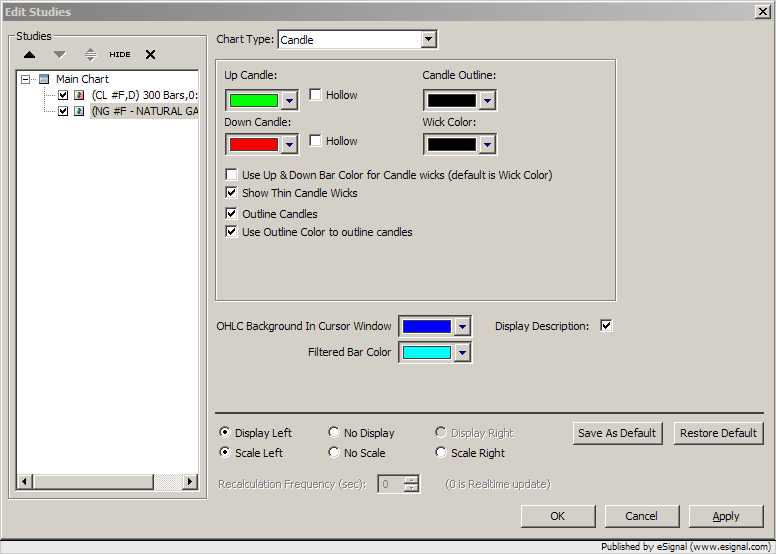
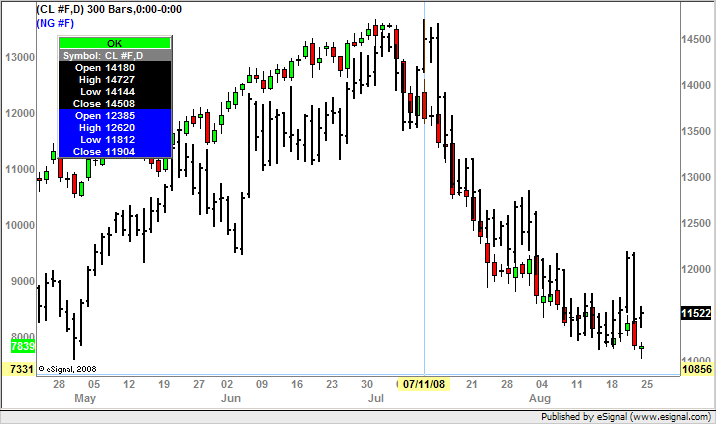
    In Edit Studies select the appropriate symbol [from the Studies list] and set its Scale to Display Left and Scale Left (see enclosed screenshots showing the Edit Studies window and the resulting chart)
    Alex


    Originally posted by pippi
    Hello,

    is it possible to add a 2nd dataseries to a chart? For example, i want to plot Nat Gas and Crude Oil in the same chart, with the NG price axxis plotted on the right side, and the CL price axxis plotted on the left side.

    Regards,
    P.
    Comment


    • #3
      Thanks, got it.

      Comment


      • #4
        pippi
        My pleasure
        Alex


        Originally posted by pippi
        Thanks, got it.

        Comment


        • #5
          Hi,

          could someone tell me how I add a 2 dataseries to a chart at all?

          I also would like to see the 2 symbols among each other and not in one chart on top of each other.

          Thank you!

          Comment


          • #6
            MHundred

            could someone tell me how I add a 2 dataseries to a chart at all?
            See the section dedicated to Symbol Overlay in this article in the eSignal KnowledgeBase

            I also would like to see the 2 symbols among each other and not in one chart on top of each other.
            If you are asking how to chart each symbol in a separate window rather than overlaying them then at this time eSignal does not offer this functionality. It is possible however to accomplish a similar task using efs such as the Candlestick Indicator.efs which is available in this thread or the SymbolCompareAsNPS.efs and SymbolCompareAsNPS2.efs which are available here
            Alex


            Originally posted by MHundred
            Hi,

            could someone tell me how I add a 2 dataseries to a chart at all?

            I also would like to see the 2 symbols among each other and not in one chart on top of each other.

            Thank you!

            Comment

            Working...
            X