Hello,
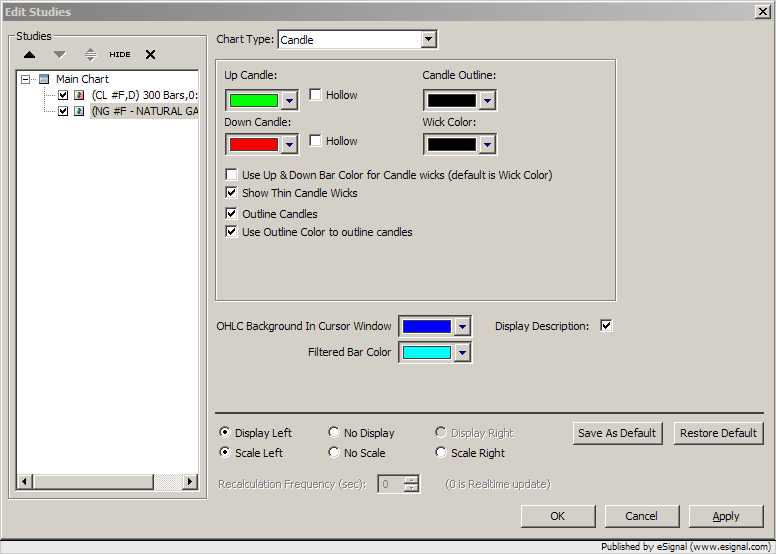
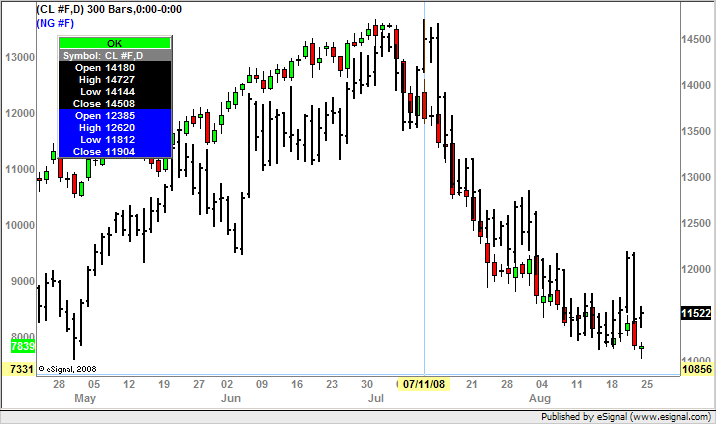
is it possible to add a 2nd dataseries to a chart? For example, i want to plot Nat Gas and Crude Oil in the same chart, with the NG price axxis plotted on the right side, and the CL price axxis plotted on the left side.
Regards,
P.
is it possible to add a 2nd dataseries to a chart? For example, i want to plot Nat Gas and Crude Oil in the same chart, with the NG price axxis plotted on the right side, and the CL price axxis plotted on the left side.
Regards,
P.


Comment