Announcement

Collapse
No announcement yet.

"Warped" trend lines

Collapse
This topic is closed.
X
X
 
  • Filter
  • Time
  • Show
Clear All
new posts

  • "Warped" trend lines

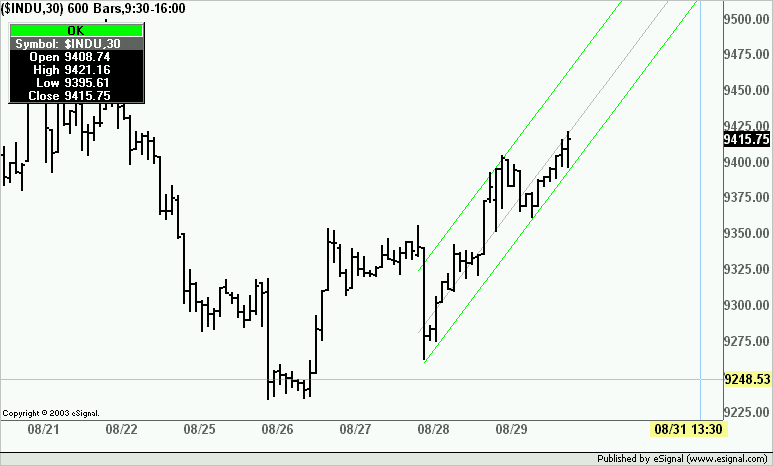
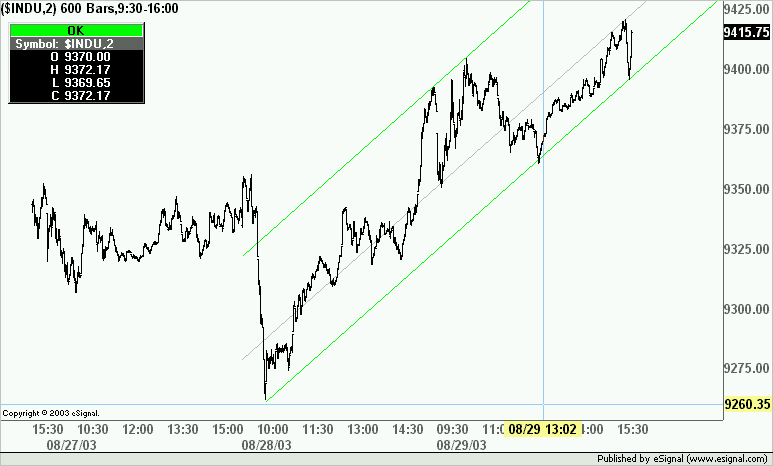
    I use trend lines in multiple time frames. For instance, I may draw a trend line in the 30 minute chart of the S&P emini and then switch that chart's time frame to the two minute, and then attached the previously drawn lines to "fine tune" the line support.

    I am finding that when I do this some of the trend lines warp from their initial angle rendering them useless, or worse they then give me erroneous support/resistance information because of the warping.

    I have my chart scale set to auto scaling. Is there something I am missing to prevent this from happening? It seems like a pretty elementary but vital need to keep lines correctly angled on a chart.

    Thanks in advance for any advice you can give me,

    David Smith

  • #2
    "Warped Channel Lines"

    Let me clarify my last inquiry. I can't even get a trend channel's lines to stay parellel when drawing in a higher time frame and then switching to a lower time frame.

    For instance, I drew an upsloping line connecting lows to each other in the 30 minute time frame for the emini's, then simply copied that line and moved it upwards to create a potential trend channel. Then, I switched to the 2 minute time frame for that chart and the lines were no longer parallel lines, but instead one had "warped" from the other. The origin point stayed the same on both lines but not their parallel relationship.

    This is a sophisticated charting software, so there must be a way to correct this.

    David Smith

    Comment


    • #3
      David
      One chart setting that usually causes this is Logarithmic Scale.
      Right click on the chart, select Scaling and make sure Log Scale is unchecked.
      You may need to redraw your lines even after unchecking Log Scale
      Alex

      Comment


      • #4
        No, log was off...

        Alex,

        I wish it were that simple. No, log scale was off. Just to make sure I turned it off, redrew all lines in 30 minute time frame, dragged a line again to make a trend channel, and sure enough when I then switched to the 2 minute time frame the top trend line was warped upward, while the lower trend channel line remained the same as drawn.

        If this is an inherent bug that can't be worked out, it is a very serious problem.

        David

        Comment


        • #5
          David
          It does not seem to happen at my end using ver 7.4 as can be seen in the following images.
          Here is a 30 minute chart on which I have drawn a trendline and two parallels


          And here are the same trendlines on a 2 minute chart


          You may want to post an image of what is showing on your screen so that eSignal may have an idea of the type and extent of the issue.
          Alex

          Comment


          • #6
            Charts attached to illustrate error

            Alex,

            Ok, the first chart is of the most recent action in the 30 minute S&P emini futures. I simply drew a few angled lines and duplicated them to create trend channels.

            The second chart is what happened to the lines when I simply changed my chart to a two minute time frame.

            Clearly the blue lines that were parellel, and the black lines that were parallel in the larger time frame have become distorted.

            I am running version 7.4 build 608.

            Again, any help in this matter would be greatly appreciated.

            David Smith
            Attached Files

            Comment


            • #7
              Second chart (2minute) attached

              This is the second chart I mentioned in the previous post.

              David Smith
              Attached Files

              Comment


              • #8
                This has to do with the Time Template being used. I am able to duplicate the problem when using a 6:30-13:02 Time Template (Pacific Time here,) but when I switch to a 6:30-13:00 template it works fine after I redraw the channel. I suspect this has something to do with the way the chart is trying to redraw the anchors when a more specific interval is used. I'll pass this information along to our QA group to look at further.
                Regards,
                Jay F.
                Product Manager
                _____________________________________
                Have a suggestion to improve our products?
                Click Support --> Request a Feature in eSignal 11

                Comment


                • #9
                  Time Template

                  Hey, thanks for the reply, I appreciate it very much. I added the one bar at the end of the day because for some reason if one leaves the time set to the regular closing time, it doesn't chart the final bar.

                  Anyway, if there is something else I can do in the meantime before a new build comes out, etc., please let me know. I think the program is one of the best out there, and I don't even want to think about changing to another company's data feed but I use trend lines a lot in my trading.

                  Thanks again for your response, I look forward to the resolution to the difficulty.

                  David Smith

                  Comment


                  • #10
                    I think I was a bit too quick to blame this on the Time Template. I went to a daily chart, drew a trend line and copied it to make a channel. Moved down to a 30 minute chart, and while the lines did look parallel, I scrolled out far into the future, and they eventually crossed. I think there is a difference with the way a drawn line's anchors are adjusted when moving down to a smaller interval, and a copied line. I'll pass this further info along.
                    Regards,
                    Jay F.
                    Product Manager
                    _____________________________________
                    Have a suggestion to improve our products?
                    Click Support --> Request a Feature in eSignal 11

                    Comment


                    • #11
                      You don't even have to change intervals. Over time, the lines will skew and migrate. Lines set on day 1 will have migrated on day 2. Except for lines set fresh for the current day, and viewed in the time-frame they were created, advanced chart trend lines are inaccurate and cannot be relied on. I use a lot of lines and this is a major issue on my bug list since the original advanced charts release. Also, lines can't be created by slope or checked for slope to see if a line has skewed from the original setting. Will be great when line issues are finally fixed.

                      Comment


                      • #12
                        Multi-time frame trend line warping

                        This is a serious problem.

                        I rely on trend lines as vital aspects to trade entry/exit. I hadn't noticed this problem before as I was not looking at lines drawn in other time frames, only the time frame I drew them in. However, I have come to use them more and more on multiple time frames. If this issue can't be rectified I will change charting programs and data feeds.

                        You sound like you have experienced this issue in the past. Have you brought it to the attention of the programmers previously? And, if so what has been their issue with not fixing it? Trend lines and their reliance are a fundamental tool in technical analysis. I don't know why this would be let to go on in error if it was brought to Esignal's attention.

                        Thanks for your input.

                        David Smith

                        Comment


                        • #13
                          Lancer
                          FWIW I am not seeing the issue of trendlines shifting position and I too use a lot of lines in all time frames.
                          As an example the chart below was created in August 02 and in it there are two groups of trendlines arranged as fans. The magenta one was created together with the chart shortly after the July 02 low and the red one was created in March of this year (both indicated by arrows in corresponding colors).


                          Following is a new chart created today with the same set of lines based on the same points. As far as I am concerned the two are virtually undistinguishable from each other.


                          The same could be shown using my intraday charts where the intervals get changed constantly and where some of the trendlines can go as far back as a few months.
                          Alex

                          Comment


                          • #14
                            Don't know what to tell you Alex. I could post 100 charts showing skew and migration. Also, mislocation due to changing periodicity. I see it every day. If interested, try some testing using intraday periods (3 min, etc.), and see what you get. For example, make a test grid of equally spaced parallel upslope lines at X slope and parallel downslope lines at -X slope. Change chart time periods and note the location changes. Note the location changes from day to day without a time period change. Each day, copy or move some of those lines to new points, extending the grid forward with time. Won't be too long and once-parallel lines will start intersecting. It's the way it's always been with advanced charts.


                            David,
                            I identified the issue in the very first advanced charts release, and it remains a prominent item in an improvement recommendation report I submit to eSignal about every month. Other charting programs have similar line issues to one degree or another (including Metastock and Ensign, for example), so lines must be difficult objects for programmers to deal with. I've received no feedback from eSignal as to when the issue might be addressed.

                            Comment


                            • #15
                              A workaround?

                              How the hell do you work around this? If I had known that I couldn't even draw a simple trend line and rely on the program to render it accurately the next day, I certainly would not have subscribed to Esignal in the first place.

                              Are you saying that the only trend lines that are accurate are the ones that are drawn in, and then subsequently viewed in the same time frame? All others are inaccurate? If that is the case, then Esignal needs to post disclaimers--at the very least--to that effect when someone purchases the service.

                              Please tell me more about your experience with this limitation.

                              David Smith

                              Comment

                              Working...
                              X