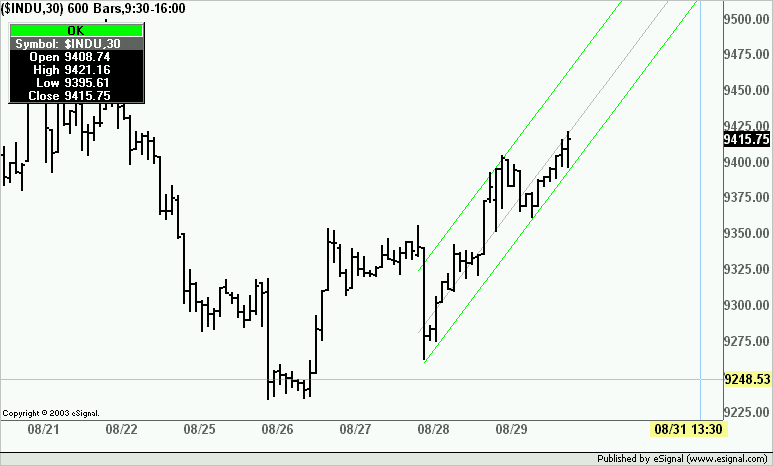
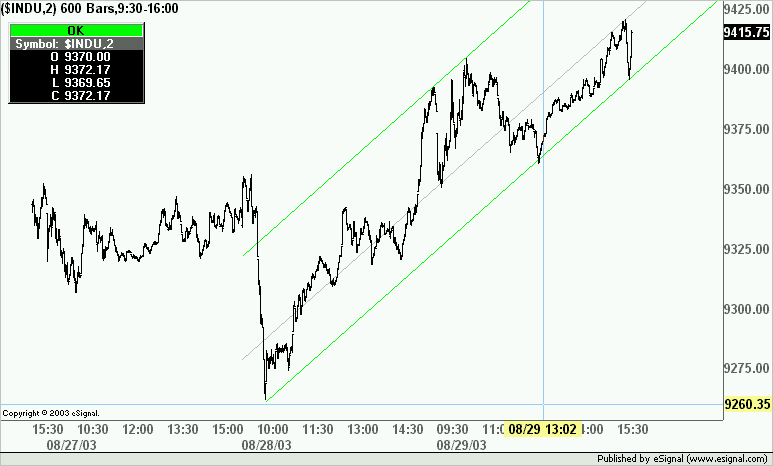
I use trend lines in multiple time frames. For instance, I may draw a trend line in the 30 minute chart of the S&P emini and then switch that chart's time frame to the two minute, and then attached the previously drawn lines to "fine tune" the line support.
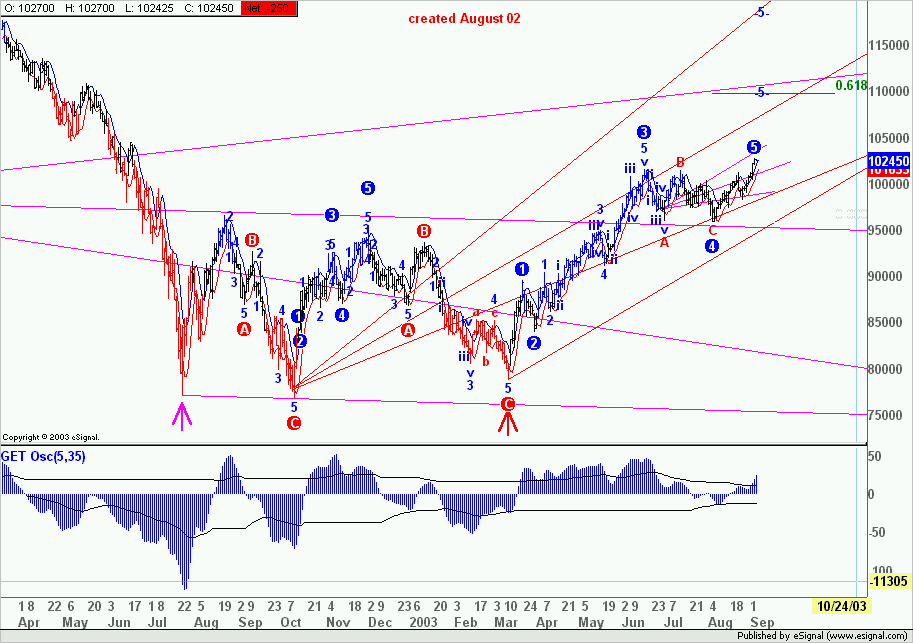
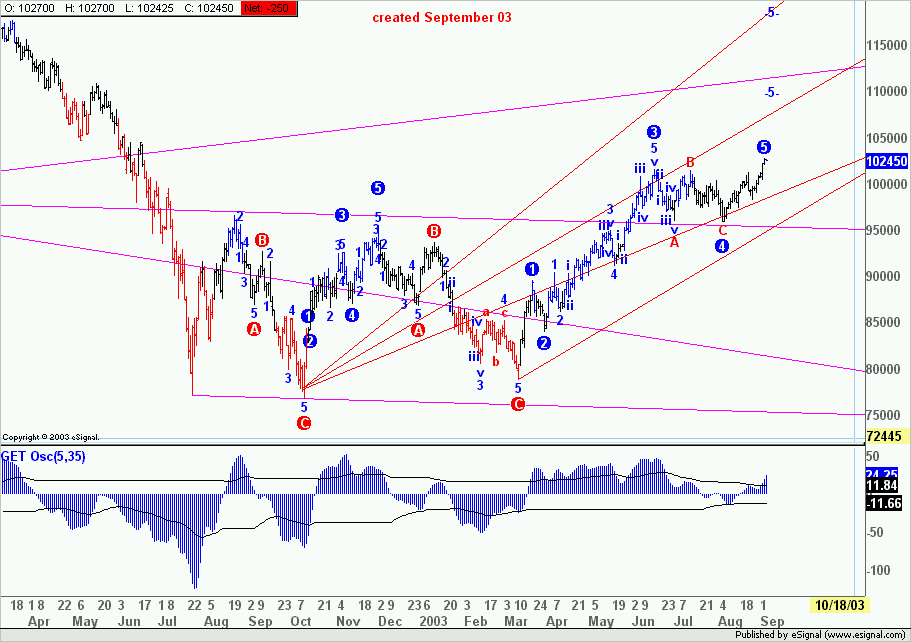
I am finding that when I do this some of the trend lines warp from their initial angle rendering them useless, or worse they then give me erroneous support/resistance information because of the warping.
I have my chart scale set to auto scaling. Is there something I am missing to prevent this from happening? It seems like a pretty elementary but vital need to keep lines correctly angled on a chart.
Thanks in advance for any advice you can give me,
David Smith


Comment