Announcement

Collapse
No announcement yet.

"Warped" trend lines

Collapse
This topic is closed.
X
X
 
  • Filter
  • Time
  • Show
Clear All
new posts

  • #31
    So, that's it?

    Well, I guess we just live with a software program that can't do trend lines in alternate time frames then, correct?

    Has anyone at Esignal done any further research into this issue yet?

    Can anyone tell me at least if you have put together a list of graphics cards that do indeed work with the software, or do we just hope that most people don't use trendlines in their trading?

    I expect some follow-up either here or a personal email from a representative of the company. You don't have difficulty charging me each month for the service, at least you can touch base and let me know what the status of a known flaw (major flaw) is.

    If it's my graphics card, that's fine, but I'd appreciate it if Esignal posted or notified users of known conflicts with cards, and compiled a list of cards that do not have issues. so that I can purchase one -- if indeed that is the difficulty.

    It's not like trendlines are irrelevant to trading now is it?!

    David Smith

    Comment


    • #32
      Re: So, that's it?

      Originally posted by Echelon
      Well, I guess we just live with a software program that can't do trend lines in alternate time frames then, correct?

      David Smith
      David YOU are living with this problem.

      AFAIK 99.9% of the others users:

      A)Do not

      B)Are a bunch of Dumb

      Chose among the multiple answers

      I RESTATE: You got the Problem , others not. So there must be a solution.

      My Humble advise ? Change card right know.

      This job is too serious :

      I can speak just for myself and the traders that I know:
      I'm changing all my 1 yr old 2 PC P4 with Pharelia and RADEON 9000 with two new P4 3.0 with new motherboards and 2 cards QUADRA YPN for one and 1 card QUADRA YPN for the other.

      Results: trading in the others I'm going to spend about 1000$ for two new machines . Wich is not such a big amount of money.
      A YPN card is new about 350$ used much less.

      My opinion is that We are in premiere league , we ought to be geared up for that.
      Fabrizio L. Jorio Fili

      Comment


      • #33
        Alright Fabrizio, you're over the line. Tone it down a notch. It's incorrect to think that because an eSignal user doesn't post a problem in this forum that the problem doesn't exist, or that it isn't statistically relevant. Get beyond that premise. Problems are reported in many ways besides posting here; (e.g. email, LiveRep, IRC chat, phone). I've used all of those for problems not posted in this forum. Also, the user has to recognize the problem in the first place. All users don't report all problems.

        For example,

        that is a multi-day eSignal server issue, absolutely no fault of the client user. The issue affected who knows how many eSignal users over multiple days (everyone with a market depth window maybe?), yet only two users posted the problem is this bulletin board. Don't assume that just because no or few users post an issue in this forum, that a problem doesn't exist, or that it is limited to only those who post here. Ask any fisherman and he'll tell you that for any one jumper, there's many more fish underneath.

        As to the trendline issue, I don't think it has anything to do with the video card. As I stated in a prior post, I've seen the problem on different machines, with different video cards. Others reporting the issue have different cards as well. Further, a user has to use lines intensely to even realize the problem. The occasional line user, or user of few lines will not recognize the issue and might not even have a true understanding of the specific line behavior we're even talking about in this thread.

        Comment


        • #34
          Lancer

          I red you always as a nice and competent person. I respect you as I do with everyone
          Sarcasm used repetiously as a main rule fill up the boxes uselessly.

          So do not open your message in the way you did . Ok? Do not do it again.

          I tell you so for you could be my son.

          Thank you

          Cordially

          Ps. The rest is polemic. I gaved in the prior message my humble advise. Period.go to this link and you'll see 10 charts with no moving lines
          Last edited by fabrizio; 09-26-2003, 09:42 AM.
          Fabrizio L. Jorio Fili

          Comment


          • #35
            Statistical Insignificance

            Well then, Fabrizio, let's use your statistical logic as an approach to this problem. However, I contend that if it's happening to me and my trading it isn't statistically insignificant to me at all, hence your attempt at a solution methodology is ill focused.

            But, I'll bite anyway. Let's see then, I should take the purported solution of one lone responder (outlier?), who isn't a technician, has no knowledge of the underlying software code, perhaps little knowledge of hardware-software interaction, but is just one trader who happened onto a workable solution for himself.

            Now, wouldn't it be more logical (and statistically viable) for me (and Esignal technical staff -- of which there are probably more than one) to include that information into a more complete and testable enquiry into this problem? And, wouldn't it be a good business decision on their part to keep customers like me informed as to the status of that enquiry?

            I don't think I have to go on here. The point is the problem exists, it's a significant problem from a technical trading standpoint, and it's Esignal's responsiblitly to attend to it's customer's and it's software's problems. Statistically significant or not, it's simply good business.

            Bad business, however, would be me having to take my computer to the shop, pay to have another board put in, configured, and then having the same problem persist, only to find that your perhaps temporary solution isn't a solution at all, but merely a clue as to where in the software code the flaw lies.

            In short, it would be statistically stupid and a bad business decision on my part at this point to follow your advice without any further correspondence with the company who makes and supports the software.

            That, is what this forum is for my friend, so get over it and get on with your trading.

            Comment


            • #36
              Echelon

              This is - IMHO- a very savy manner to approach the problem.

              I agree on almost everithing you are saiyng. I even agree on the fact that my solution is ill focused. Yes , for despite the fact that the fisrts PC computer I had was in 1981 in my office in San Francisco at Esprit de , 900 Minnesota avenue, and by that time I had the pleasure of socially spend some with Steve Job and my chairman , I know zilch of programming and of PC computers. As a matter of fact my knowledge is more ERP orientated for the reason you can Imagine: and my EDP staff was taking care of the nitty gritty with Micro Strategy or Sap.

              So said , my solution is ill focused but works. And is not a "patch" since I have no problems hence.

              Again why you have it? This is the point.

              Let put it in this way: IMHO the corp. behaviour is Ethic. Since there is no major , I mean major evidence that the problem comes from the soft.

              I have sometimes a problem on one page that has a certain background color : that problem do not appears always, is ONLY on that page with taht color background, and if I replicate on another page does not happen. I mean is JUST ON THAT PAGE . NO OTHER Page s has it . NEVER EVER HAD.

              What should I do? Cal 155 times ESIGNAL yelling that they have to fix it? If cannot even replicate it at command how could they?
              That I cannot live with it?

              So my friend let-s go back both trading with pleasure and hefty profits, in good sake and happy. Because -as the good two cent philosopher I am - it what really counts.

              Afterall.

              Bye Bye

              one more think sorry it is absolutely and not stupid- never said or even thought this - correct from your side ask to the company a solution, it is your undisputable right as a customer.
              But what I think is slightly out of place and useless is sarcasm not the proactive attitude of a client to have his soft working according his expectations.
              Last edited by fabrizio; 09-26-2003, 11:13 AM.
              Fabrizio L. Jorio Fili

              Comment


              • #37
                Replicated error, second computer

                I just pulled out my Gateway laptop this afternoon, loaded the latest version of Esignal, and replicated the same warped trend line issue on it.

                The process is as follows: pull up a chart of the S&P emini futures, go to a time frame (I used 30 minutes) draw a line, copy it many times so you have a parallel channel drawn. Then I dropped down to a one minute time frame, moved some of the lines to points of origin on the chart, etc., then I went back to the 30 minute time frame. Sure enough, some of the lines "warped" from being parallel lines.

                For informational purposes, the computer is a Gateway running Windows 98, and the video card is a Neomagic Magicmedia 256AV. Please note, this is a different video card than the card in my IBM desktop computer that also has the issue.

                I will load the software on my wife's Dell computer this evening, re-run the above experiment and post back here the results.

                I will run this on as many computers as I can find in the next week or so and post the results here.

                David Smith

                Comment


                • #38
                  Three separate computers...three errors.

                  Well, this evening I persuaded my wife to let me download the latest version of Esignal's software, and install it to her computer.

                  The computer is a Dell -- I don't know the model but it is less than a year old running Windows 2000.

                  I duplicated the last experiment using the S&P emini, parallel lines drawn in thirty and sixty minute time frames, then went to one minute, and also three minute time frames, moved the lines to "attach" them to market highs and lows, switched back to the thirty minute time frame, and the lines warped from their original parallel positions, just like the other two computers I have tested.

                  The video card is a Radeon Mobility (ATI Mobility M6). Now, certainly three computers with this error replicated by me is not a statistical sample of the entire Esignal user base, but from a practical standpoint even if I simply assume that it is a video card conflict and not a software bug, I am hard pressed to waste my time replacing cards since I haven't found one compatible yet!

                  Again, I would appreciate it if a representative from Esignal would let me know exactly what video cards/computer configurations you are using without getting this problem. Or, I would like to know what your technical staff's expert opinion is regarding the cause of this problem.

                  Look, I can overlook something like a background color not conforming to what I set, last time I checked market moves didn't conform to what color my screen is, but trendlines are a vital tool for market analysis. How would you feel if your word processor didn't type all the letters of the alphabet?

                  I will continue to load this software on any computer I can find and post the results here -- at least others should know that they can't rely on trendlines in this software for making trading decisions.

                  Comment


                  • #39
                    After much testing and discussion, we have found the cause of the problem. First off, I’ll reiterate the symptom, and then go into the cause following that.

                    Symptom:
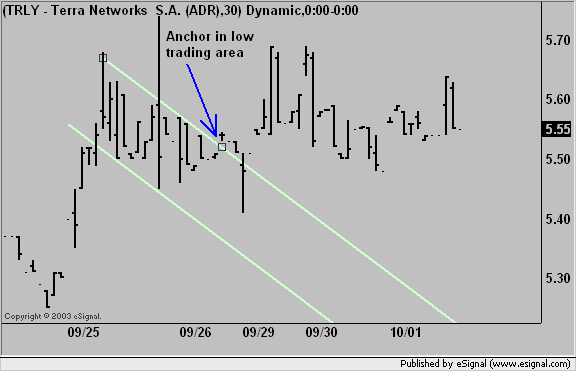
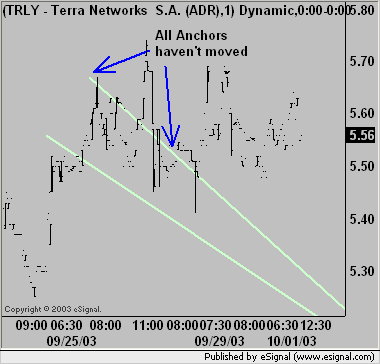
                    Parallel trend lines are not staying parallel when the original lines are drawn on a higher interval, and the chart is switched to a lower interval.


                    Please notice in the above screenshot the anchor of the original line is in a low trading area (i.e. # of trades). The anchor for the parallel line (the bottom line) is moved over to the left 5 bars


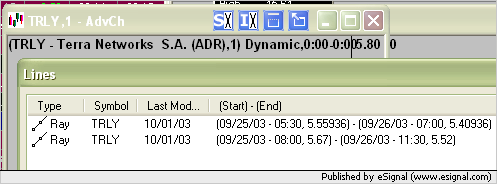
                    In this screenshot, the lines are no longer parallel. If the anchor points are pulled up in the Line List, the anchor points have not changed (see below).


                    So why are these lines not parallel??

                    Cause:
                    When we drew our lines on a 30-minute time frame and moved to a 1-minute time frame, we need to have 30 1-minute bars for each 30-minute bar in-between the corresponding anchor points in order for the lines to remain parallel. When this does not occur, the lines will no longer be parallel, and the less 1-minute bars the more dramatic comparative angle. This is why some users were not able to duplicate the problem as they were likely looking at higher volume issues.

                    Now the question is how can there be less than 30 1-minute bars per 30-minute bar? The answer is that a bar space is not created if no trades occurred within the allotted time interval.
                    Regards,
                    Jay F.
                    Product Manager
                    _____________________________________
                    Have a suggestion to improve our products?
                    Click Support --> Request a Feature in eSignal 11

                    Comment


                    • #40
                      This poses and interesting question.

                      First, let me say thank you for taking the time to research this issue further. I have loaded the program onto half a dozen computers in the past week or so and was able to replicate the problem on each and every machine -- so, it became clear to me that the issue was NOT a video card problem. Or, if it was then I'd be hard pressed to find a card that worked!

                      Anyway, your research into this issue then leads me to ask a question relative to how I use trend lines. I tend to draw lines off a pivot low or high and end my line into the future "space" in the right hand margin of the chart (into the future of yet to be market trades in time). By your logic then, this can only lead to failure of lines drawn in that way because between my first and second mouse "click" to form and extend the line as a ray into the future, is contained market bar "space" without any trading activity yet. Am I correct in this assumption of failure here?

                      And, if so, it follows that a simple work around would be to draw my line in the way I describe, then move that line "back" in time over a section of the chart that contains trades for each time bar, then draw another line over the top of the first line to get my angle correct, then move my second line back to my pivot point origin and extend it as a ray. Would this then allow me to get the angular line drawn correctly, and do so in chart space that contained trades so it would not "warp"? Or is it that since by now moving the line "forward" in time to my pivot high or low, that the space that would now exist between my first and second mouse clicks--previously drawn--but now not containing trades into the future, would render this line susceptable to "warping" when switching to another time frame?

                      Thanks in advance for taking the time to pursue the answers to these questions. I know others will be very appreciative to know the answers as well.

                      David Smith

                      Comment


                      • #41
                        Jay,

                        Now the question is how can there be less than 30 1-minute bars per 30-minute bar? The answer is that a bar space is not created if no trades occurred within the allotted time interval.
                        Shouldn't this be considered a bug? It seems to me if no trades happen that a space should be created with the HLOC being the same - that of the previous bars close. Volume would be reported as zero. Am I wrong?

                        Garth
                        Garth

                        Comment


                        • #42
                          I've always considered the omission of no-volume periods to be a critical deficiency. I don't think it's a bug really because I've been told by staff that missing time periods on the x-axis time scale is by design. Depending on the user/situation, this may or may not be desirable. For the line user, a skewed time scale is a huge problem, making interday lines unreliable on intraday charts. For those that don't use lines, maybe they prefer the continuity of price bars and plotted studies, with no interrupting zero-volume periods. Anyway, fixing the skewed x-axis has been item #1 on my improvement suggestion list for over a year now (first reported to eSignal over a year ago, with monthly follow-ups). eSignal staff says it's not an easy change.

                          fwiw, here's some of the report text:

                          "No-Volume Periods Do Not Display: (Critical Item) In premarket and postmarket, often there are periods where there are no trades (no volume). Also, low volume issues may contain periods during the regular session where there are no trades. On a standard chart, the "no-volume" period is plotted as a blank period, and the horizontal time scale increments remain correctly spaced. That is, all time periods are accounted for on the x-axis, whether or not any trades occurred in that period. An hour always has 60 minutes. This true x-y (time-price) relationship assures that diagonal channel lines maintain the correct time/slope location relative to plotted data.

                          With advanced charts it's a different situation. On an advanced chart, the "no-volume" period is disregarded, and no blank period is plotted. Advanced charts disregard all periods in which no trades occur. Because only periods containing trades are plotted on the chart, the disregarded "no-volume " periods are deleted from the x-axis time scale. This means that the advanced charts x-axis time scale is always missing time (skewed) due to missing periods. Because of missing time, the x-y (time-price) relationship is not true, and in fact it's random and varies per the number of disregarded time periods in any time block. An hour does not always have 60 minutes. This explains why interday diagonal channel lines are always off-position on intraday advanced charts. It's because the x-axis time scale is compressed due to the deletion of "no volume" periods. With this missing time problem, intraday advanced charts are unreliable for diagonal channel line work, or for any other line study with a time component (e.g. Gann). It’s not just line studies that are distorted, Advanced charts also distort analytic studies. Complaints about missing no-volume periods can also be found on the eSignal Bulletin Board related to various EFS studies issues.

                          The result is that eSignal charts are a no-win situation for diagonal line users right now. On standard charts, all time periods are properly represented on the x-axis time scale (diagonal lines are reliable), but line work can't be saved. On advanced charts, line work can be saved, but due to missing time periods on the x-axis, diagonal lines are off-position and not reliable.

                          I'm amazed that this problem exists because it's just a fundamental characteristic of charts that a true and correct x-y relationship be maintained. Whether or not a trade occurs in any period, every increment of time should be represented on the x-axis.

                          Solution: Add a checkbox in Chart Properties or X-Axis Properties to enable the user to select display of a proper time scale with no missing time periods. e.g. “Display Zero-Volume Periods”."

                          Comment


                          • #43
                            For those that don't use lines, maybe they prefer the continuity of price bars and plotted studies, with no interrupting zero-volume periods.
                            I'm not even sure that is the case for studies. From my POV the fact that the price didn't move during a period indicates that nobody saw enough of a descrepency in price vs. value to buy or sell. Of course, this assumes active trading hours. In off hours I do think it would mess us a study, but that's what time templates are for.

                            Garth
                            Garth

                            Comment


                            • #44
                              QUESTIONS FOR ESIGNAL STAFF.....

                              Just in case you missed the post containing questions that I posted over the weekend in this thread, please respond at your earliest convenience to the following:

                              First, let me say thank you for taking the time to research this issue further. I have loaded the program onto half a dozen computers in the past week or so and was able to replicate the problem on each and every machine -- so, it became clear to me that the issue was NOT a video card problem. Or, if it was then I'd be hard pressed to find a card that worked!

                              Anyway, your research into this issue then leads me to ask a question relative to how I use trend lines. I tend to draw lines off a pivot low or high and end my line into the future "space" in the right hand margin of the chart (into the future of yet to be market trades in time). By your logic then, this can only lead to failure of lines drawn in that way because between my first and second mouse "click" to form and extend the line as a ray into the future, is contained market bar "space" without any trading activity yet. Am I correct in this assumption of failure here?

                              And, if so, it follows that a simple work around would be to draw my line in the way I describe, then move that line "back" in time over a section of the chart that contains trades for each time bar, then draw another line over the top of the first line to get my angle correct, then move my second line back to my pivot point origin and extend it as a ray. Would this then allow me to get the angular line drawn correctly, and do so in chart space that contained trades so it would not "warp"? Or is it that since by now moving the line "forward" in time to my pivot high or low, that the space that would now exist between my first and second mouse clicks--previously drawn--but now not containing trades into the future, would render this line susceptable to "warping" when switching to another time frame?

                              Thanks in advance for taking the time to pursue the answers to these questions. I know others will be very appreciative to know the answers as well.

                              David Smith

                              Comment


                              • #45
                                David,

                                Anchoring a line into the future may or may not cause a problem, but is not a cause of the problem in itself. Let me explain further...

                                When a line is created two anchors are established based on the first and second click of the mouse. Each of these anchors have unique Price and Time qualities that never change. On a chart that has a definite time scale (i.e. a non-tick based chart), the area to the right of the most current bar is easily assigned an estimated time for each "bar slot".

                                As an example, on a 1 minute chart, if the most recent bar is at 8:00 and I draw a line from 7:55 to a point in the future 10 "bar slots", then the time of the second anchor would be 8:10. Let us also make a copy of this line and move it back in time, so the 2nd anchor is in an established time area (i.e. prior to 8:01). If all 10 1-minute time periods have a trade in it, then everything is kosher, but if one or more of the time periods does not have a trade, then the distance between anchors has decreased, and we're in a situation where the original line and the copied line are no longer parallel.

                                Essentially, line "warping" can only occur if a time period is removed due to no trading occurring within that same time period. It may not affect lines anchored into the future, because it is unknown whether or not trades will occur during all time periods between anchors.

                                I hope this information helps!
                                Regards,
                                Jay F.
                                Product Manager
                                _____________________________________
                                Have a suggestion to improve our products?
                                Click Support --> Request a Feature in eSignal 11

                                Comment

                                Working...
                                X