Announcement

Collapse
No announcement yet.

MARKET PROFILE (questions from a former CQG MP user)

Collapse
This topic is closed.
X
X
 
  • Filter
  • Time
  • Show
Clear All
new posts

  • MARKET PROFILE (questions from a former CQG MP user)

    Hi,

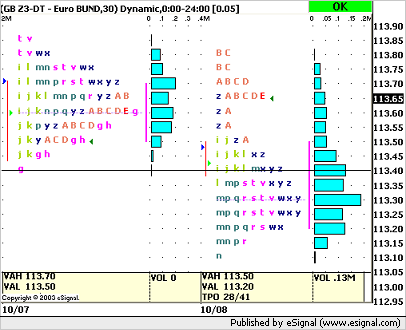
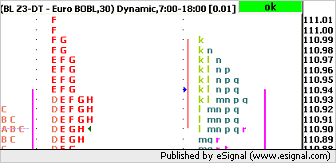
    I am trading the BUND and BOBL on Eurex using CQG Market Profile. I would like to know if new eSignal Market Profile works on any symbol like with CQG. Do you have also a TPO counts (equivalent to CQG cursor in MP) and can I split the TPOs and remove splits ?

    As for the value area calculation are there the following possibilities :
    - calculate value area based on TPO counts
    - calculate value area based on volume traded
    - possibility to change the default 1 standard deviation to 2 standard variation

    Thanks,
    Matt.

    PS: By the way the best book on Market Profile I have read was Mind over Markets from Dalton.

  • #2
    Any symbol can be charted in Market Profile. Here's an example of the Bund.


    As for your other questions, you can split TPO's by double-clicking, and you can remove splits with a right-click. Currently, there is no way to specify the number of Standard Deviations or to use volume for the VA calculation, but I'll pass that suggestion along to our developers.
    Regards,
    Jay F.
    Product Manager
    _____________________________________
    Have a suggestion to improve our products?
    Click Support --> Request a Feature in eSignal 11

    Comment


    • #3
      I subscribed to it but it is full of bugs. Are you still working on it for eSignal 7.5 ?

      (wrong letters, wrong line on the left for opening range, doesn't remember tick increment)

      Try it on the BOBL today for example with a start of the Market with letter k (at 7am London time)

      At the end it gives a different MP than CQG.

      CQG:
      k
      kn
      kln
      klnp
      klnpq
      klnpq
      klmnpq
      klmnpq
      lmnpq
      lmnpqr

      eSignal :
      k
      kln
      kln
      klnp
      Wklnpq
      Wklnpq
      Wlnpq
      lmpq
      lmpq

      The opening range should be a line on the left with the 2 first TPOs. This is ok in CQG, but with eSignal this line doesn't go completely down. it stops on the 1st lmpq not the 2nd

      I don't understand what this W does there either

      If you fix a tick increment to 1 on a mininized MP it will never remember it and always try to guess a better higher value. This is annoying.
      Last edited by Phantom; 10-09-2003, 09:39 AM.

      Comment


      • #4
        We've been updating the MP in each release including the 7.5 beta. It might be worth loading the beta to do a better comparison. I don't know from the data you listed what day this is for and if you're using any time templates to limit the data range.

        The reason the Tick Increment changes is because different symbols have different minimum ticks. Each time you change the symbol, the Tick Increment changes to the best fit for the data on the new symbol with the goal of fitting it all into the screen. If you set the MP for a Tick Increment of 1, you can save it as the default so that the 1 is set each time you open a new MP window. You can do this by right clicking on the chart, highlighting Style Templates, and choosing Set as Default.

        We've been doing a lot with the MP window and welcome as much feedback as possible so we can continue to improve it. Please post any additional feedback in our Beta forum.

        Thank you,

        Comment


        • #5
          Phantom,

          Both the "W" and the opening range issue was caused by an invalid trades sent from the exchange at or around midnight London Time. Because of these trades, the W was formed and was taken into account for the opening range. To eliminate this problem, I suggest creating a Time Template with the below settings.


          Here's what my MP chart looks like after I make those changes.


          Regarding the Tick Increment not holding, try enabling the Force Tick feature.


          Hope this helps!
          Regards,
          Jay F.
          Product Manager
          _____________________________________
          Have a suggestion to improve our products?
          Click Support --> Request a Feature in eSignal 11

          Comment


          • #6
            The time template fixes the Eurex bug which indeed happens every day if you don't use a template (hope this will be fixed one day as this is quite a old bug)

            But the line on the left for the initial 2 TPO is still missing one k or one l each time, this is a strange behaviour I don't have on my CQG so I guess this is a bug (using 7.5 beta 3)

            Comment


            • #7
              Perhaps the Opening Range line is not appearing to draw the whole distance, because it's not drawing from the top of the highest point to the lowest of the lowest point? With the Time Template applied, it looks like it's calculating correctly, just not drawing the whole distance.

              Appreciate you pointing this out, Phantom. I'll have a report drawn up to send this to our QA Team to investigate.
              Regards,
              Jay F.
              Product Manager
              _____________________________________
              Have a suggestion to improve our products?
              Click Support --> Request a Feature in eSignal 11

              Comment


              • #8
                Bund, Bolbl problem

                I am running 7.6 (Build 636A) and I have the same problems described by Phantom with Profiles of both Bund and Bobl.

                I've applied the time template but Initial Balance line is 1 tick out on both the high and low.

                TPO's are not always printed at the high or low

                The last price indicated on the profile does not always match that shown on the price scale.

                Is there anything I can do to fix these bugs?

                Thanks.

                Comment


                • #9
                  MP problems

                  I'm having problems with 7.6 MP in two areas:

                  On the ER2 (Russell 2K) my price scaling still shows weird numbers like 56099 instead of 56100 etc.

                  Secondly, (and more an irritant than a problem affecting my trading) is the fact that the tick increment settings for the EUR are wrong on start-up (0.01 rather than 0.001) and, even though I check the "force tick increment" box, this corrected increment doesn't hold the next time I start up eSignal.

                  Any help greatly appreciated.
                  Last edited by Bob A.; 07-09-2004, 01:22 PM.

                  Comment


                  • #10
                    Market Profile composites fall apart

                    As I build multi-day composite profiles, my new composite profile "explodes" whenever eSignal requests and receives new data. So after I build a composite profile of 2-20 days, it reverts to the default of a profile for each day.

                    This is very frustrating.

                    Alexis' advice was successful! (see the reply above)
                    Last edited by TimmyFuel; 07-09-2004, 12:36 PM.
                    Tim Snyder

                    Comment


                    • #11
                      Tim
                      Try using a Time Template that loads a fixed number of Days rather than one set to Dynamic
                      Alex

                      Comment


                      • #12
                        ED Profile problem

                        I've attached an example of a problem with the Profile of ED M5 from Friday.

                        There is a missing 'C' TPO at the low of the day - 969100

                        There is an incorrect 'I' TPO at 969600 - this a bad tick as the high of the day was 969550.

                        Another problem that sometimes occurs is that the last price marker on the profile does not match the actual last price as indicated by the label on the price scale. I belive that this is the reason the 'C' TPO at 969100 is missing.

                        Are there any plans to fix these bugs in future versions?

                        Thanks.
                        Attached Files

                        Comment


                        • #13
                          Bund Profile Example

                          The is an example of the same problems but on a profile of the Bund.

                          There is a missing TPO at the low of the day - 113.84

                          There is an incorrect TPO at 114.06 - The high of the day was 114.05.

                          Also the last price marker on the profile is at 114.04, but the last price as indicated by the label on the price scale is 114.03.
                          Attached Files

                          Comment


                          • #14
                            Must composite profiles be rebuilt every time?

                            I rely on composite profiles when using Market Profile. I would like to skip the task of rebuilding the composite whenever I open a market profile advanced chart.

                            Is there a setting to enable such behavior? (or is the capability even there?)
                            Tim Snyder

                            Comment


                            • #15
                              Breaking profile dates by trading date

                              Can anyone tell me how to set my profiles to show a day by trading date rather than calendar date?

                              I want to set crude oil, for example, to build it's profile beginning at 2PM and finishing at 1:30 PM the next day to match how we divide trading dates. For example trades at 2 PM or 9PM Thursday should be part of Friday's profile with the day session close and settlement by 1:30 PM.

                              ???
                              Tim Snyder

                              Comment

                              Working...
                              X